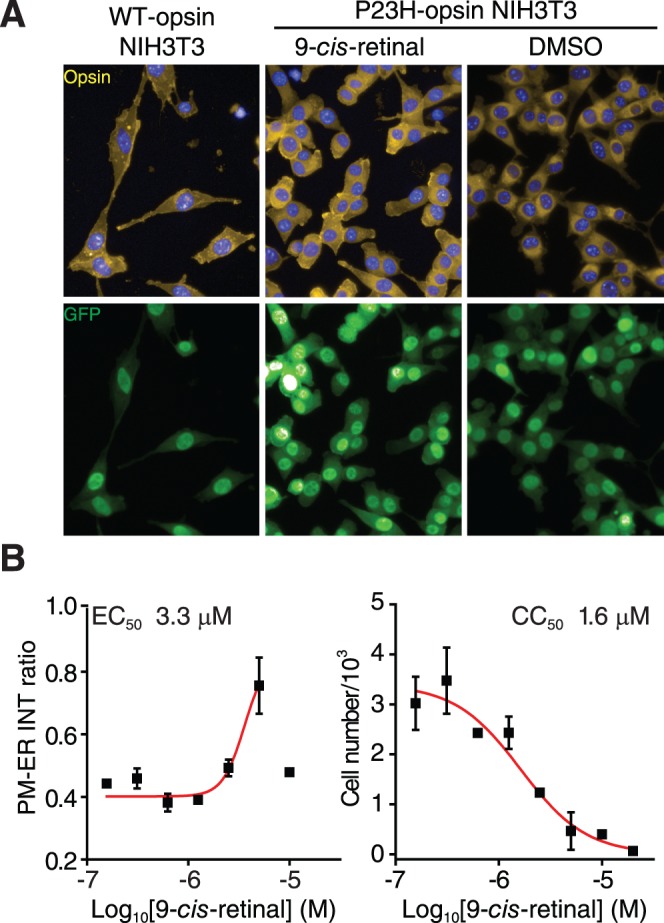
Figure 4.

Image-based analysis of P23H mutant opsin localization. (A) Immunostaining of NIH3T3 stable cells expressing the WT opsin (left), the P23H mutant opsin treated with 9-cis-retinal (middle), or DMSO (right). Yellow, opsin; blue, DAPI; green, GFP. (B) Quantification of P23H mutant opsin localization and cytotoxicity after treatment with 9-cis-retinal. Left chart: The dose response curve of 9-cis-retinal plotted by the intensity (INT) ratio of P23H mutant opsin staining on the PM to that in the ER, as a function of the Log10 [9-cis-retinal]; right chart: The change in nucleus numbers after treatment with 9-cis-retinal as a function of the log of its concentration. Concentrations of 9-cis-retinal in both charts were 0.16, 0.31, 0.63, 1.3, 2.5, 5, 10, and 20 μM. Error bars, SDs of experiments carried out in triplicate.
