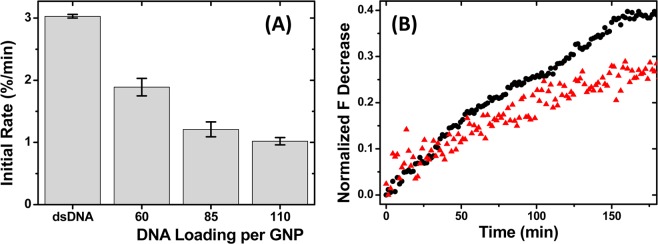
Figure 4.

(A) Comparison of initial degradation rates for M1/MC2 duplex and un-PEGylated GNP–M1/MC2s at different DNA loadings per GNP. (B) Time-dependent fluorescence intensity changes of the GNP–M1/MC2(EG12)3 at M1 strand loadings of 85 (black dots) and 110 (red triangles) per GNP.
