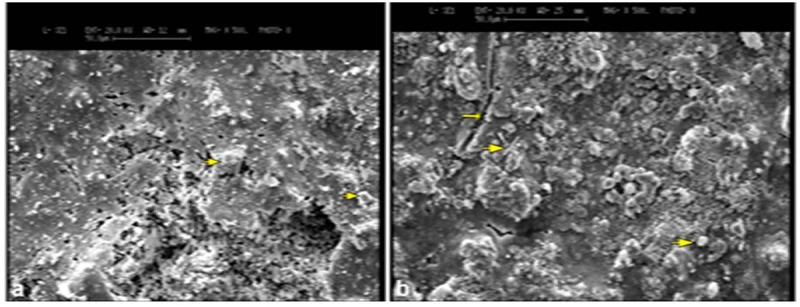
Figure 2.

: SEM image of MTA at 28 days with amorphous crystals (small arrows) b: SEM image of CEM surface immersed in STF at 28 days with porous capillaries (small arrow) and small, needle-like and amorphous crystals (large arrows) scattered in some areas (original magnification, 500×).
