Fig. 1.

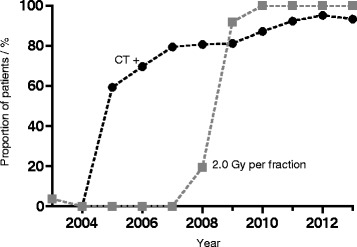
Diagram showing changes of treatment over time. Proportions of patients with and without chemotherapy (CT) as well as proportions of different fractionation schedules are shown

Diagram showing changes of treatment over time. Proportions of patients with and without chemotherapy (CT) as well as proportions of different fractionation schedules are shown