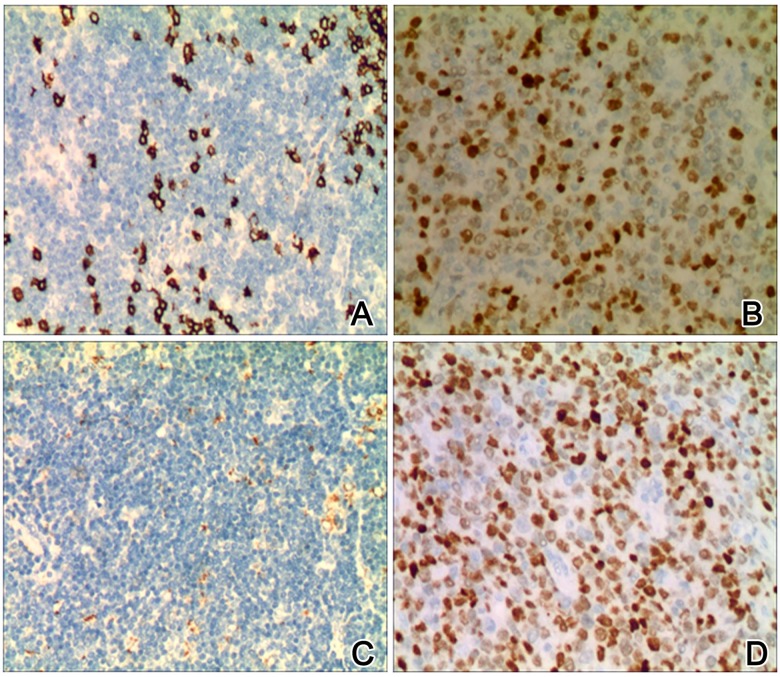
Figure 1.
Immunohistochemical (IHC) images of β-catenin p-GSK3β in MCL and control samples (×200). A and B show representative images of β-catenin in control and MCL tissues; C and D show representative staining images of p-GSK3β in control and MCL tissues. Higher expression level of β-catenin and p-GSK3β existed in MCL tissues (B, D) when compared to control samples (A, C).

