
Fig. 4.
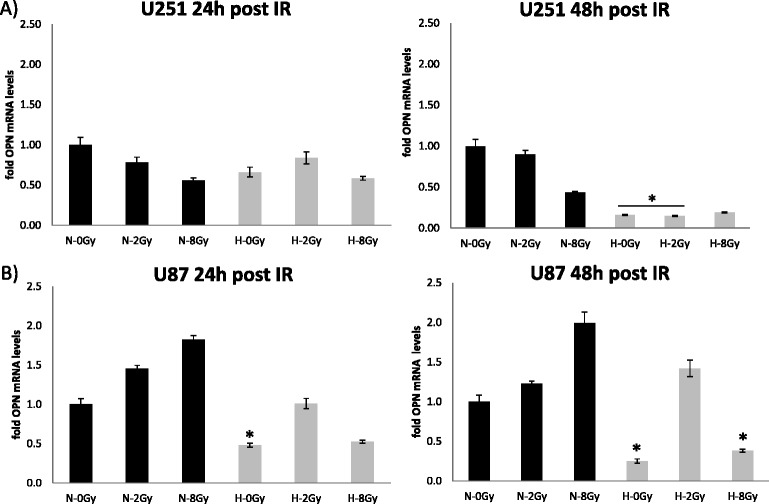
Quantitative real-time RT-PCR data showing OPN RNA expression under normoxic (N = 21 % O2) and hypoxic (H = 0.1 % O2) conditions 24 h and 48 h after irradiation (IR) with 0, 2 and 8 Gy in U251 (a) and U87 (b) glioblastoma cell lines. *marks statistical differences between normoxic and hypoxic conditions on the corresponding dose levels (ANOVA; p < 0.05)