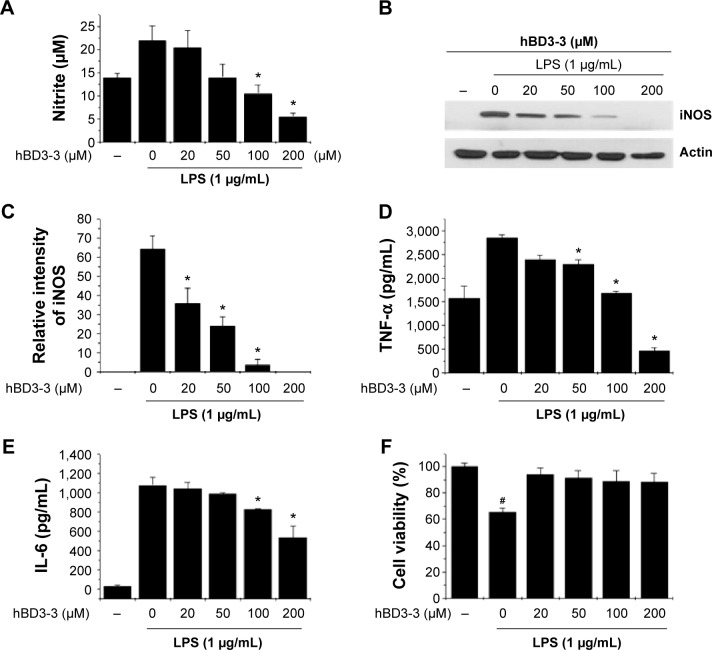
Figure 4.
The effects of hBD3-3 on LPS-induced NO, iNOS, and cytokine production in RAW 264.7 cells.
Notes: Cells were treated with the indicated concentrations of hBD3 for 1 hour before the addition of LPS (1 μg/mL) for 18 hours. Unstimulated cells were used as controls. (A) Quantitative analysis of NO production. Equal amounts of total protein (40 μg) were subjected to 10% SDS-PAGE. (B) The expression of the iNOS and actin proteins was detected through Western blot analysis using specific antibodies. (C) The level of iNOS was normalized to that of actin. Quantitative analysis of (D) TNF-α and (E) IL-6 production. (F) Cytotoxicity of hBD3-3 in RAW 264.7 cells. Cells were incubated with various concentrations of hBD3-3 for 24 hours. The number of viable cells remaining in the wells was assessed using the 3-(4,5-dimethylthiazol-2-yl)-2,5-diphenyltetrazolium bromide assay and compared with untreated cells. The data are expressed as the mean ± SD from three independent experiments in each group. *P<0.05 versus the 1 μg/mL LPS-treated group. #P<0.05 versus the untreated control group.
Abbreviations: hBD3, human beta-defensin 3; LPS, lipopolysaccharide; NO, nitric oxide; iNOS, inducible nitric oxide synthase; SDS-PAGE, sodium dodecyl sulphate-polyacrylamide gel electrophoresis; TNF-α, tumor recrosis factor-alpha; IL-6, interleukin-6; SD, standard deviation; MTT, 3-(4,5-dimethylthiazol-2-yl)-2,5-diphenyltetrazolium bromide.

