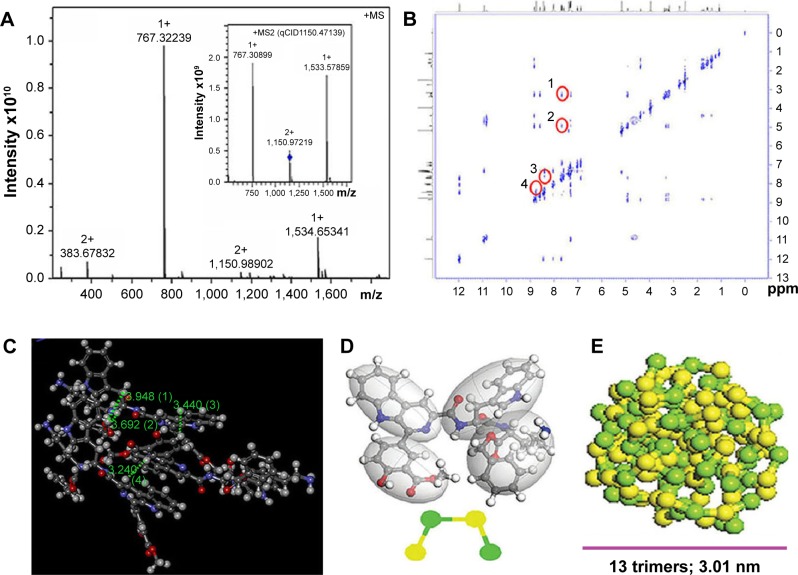
Figure 4.
FT-MS spectrum, ROESY 2D NMR spectrum, 3D structure of the trimer and predicted nano-size of PZL318.
Notes: (A) Ion peak in the FT-MS spectrum supporting trimerization of PZL318 (bearing two positive charges; 1,150.98902), of which the inset shows a qCID spectrum and indicates that the monomers and dimers resulted from fragmentation of the trimer under FT-MS conditions. (B) ROESY 2D NMR spectrum: four cross-peaks indicating the intermolecular interactions of PZL318 (labeled with red circles). (C) Three-dimensional structure of the PZL318 trimer, wherein the distances labeled with (1), (2), (3), and (4) represent the approaching manner of three molecules. (D) PZL318 molecules are built and optimized simply in the Visualizer window. “Beads” are constructed from atomistic simulations and placed at the center-of-mass of groups of atoms corresponding to the particular parts of PZL318 molecule. The four moieties are divided into four beads, and two yellow beads represent 3-methoxycarbonyl-4-hydroxyphenyl and L-Trp, two green beads represent β-carboline and L-Lys-OBzl. (E) Thirteen trimers can form a nanoparticle of 3.01 nm in diameter.
Abbreviations: MS, mass spectrometry; FT-MS, Fourier transform–mass spectrometry; qCID, quadrupole collision-induced dissociation; ROESY, rotating-frame Overhauser effect spectroscopy; NMR, nuclear magnetic resonance.

