
Figure 4.
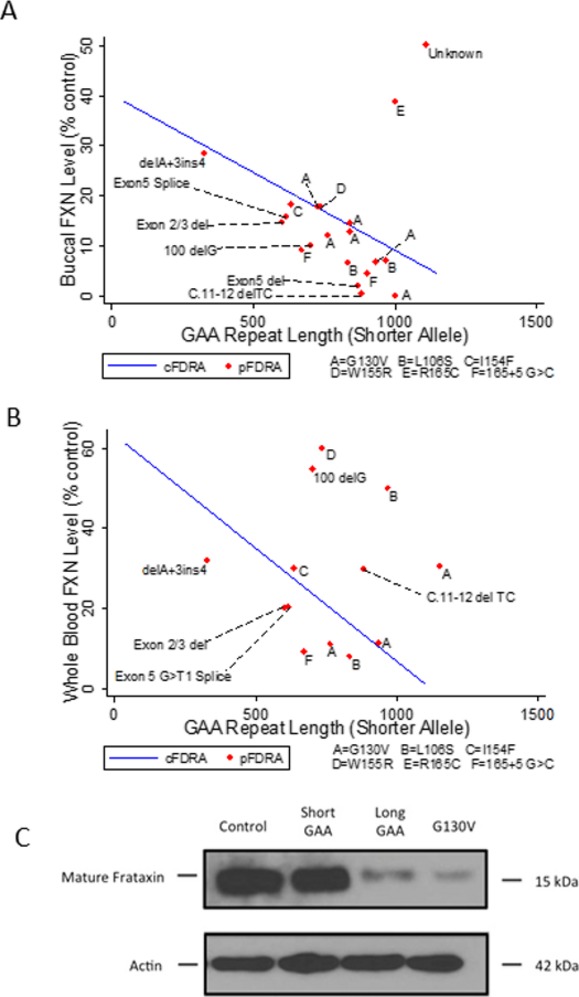
Frataxin levels in subjects with point mutations. Frataxin levels in buccal cells (ordinate, expressed as a percentage of mean control value from unaffected individuals) (A) and blood (B) were plotted in patients with point mutations against their expanded triplet repeat length (abscissa). Results from individual patients (pFRDA) are shown and labeled with the specific point mutation (A = G130V; B = L106S; C = I154F; D = W155R; E = R165C; F = 165 + 5 G>C, a splice site mutation). The line is the best fit line of frataxin level versus shorter GAA repeat length for patients carrying 2 GAA repeat expansions (cFRDA). These graphs thus present whether a point mutation generates more frataxin than the average shorter GAA repeat length in subjects with 2 GAA repeats. Almost all point mutation patients fall beneath the best fit line in buccal cells, showing that such point mutations make less frataxin than the shorter GAA repeat. The exceptions were subjects with G130V mutations, which approached the line, and mutations such as R165C, in which levels were greater than those displayed by the line. For simplicity, an individual carrying a short GAA repeat length (90) and a c.2delT mutation with highly discrepant levels between buccal cells (22% of control) and blood (157% of control) is not displayed, nor are two individuals with FARA carrying a single point mutation (L156P or c.2delT) and no identified GAA repeats (reference 7) (C). In fibroblasts, G130V patients had levels less than those of both a short GAA repeat patient and a long GAA repeat patient. FRDA, Friedreich ataxia; GAA, guanine–adenine–adenine.