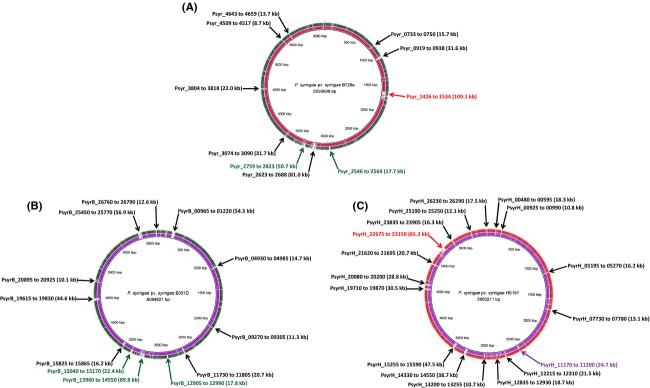
Figure 3.

Circular representation of three genome comparisons using the BLAST Ring Image Generator (BRIG) software (Alikhan et al. 2011). The inner scales designate the coordinates in kilobase pairs (kbp). White spaces indicate regions with no identity to the reference genome. The gene clusters absent in B301D are indicated by a red arrow, clusters absent in HS191 are indicated by a green arrow, clusters absent in B728a are indicated by a purple arrow, and clusters absent in both the query genomes are indicated by a black arrow. (A) B728a genome (center) compared against the genomes of B301D (Ring 1 in red) and HS191 (Ring 2 in green). (B) B301D genome (center) compared against the genomes of B3728a (Ring 1 in purple) and HS191 (Ring 2 in green). (C) HS191 genome (center) compared against the genomes of B728a (Ring 1 in purple) and B301D (Ring 2 in red). Relative shading density (from darker to lighter) within each circle represents relative levels of nucleotide homology.
