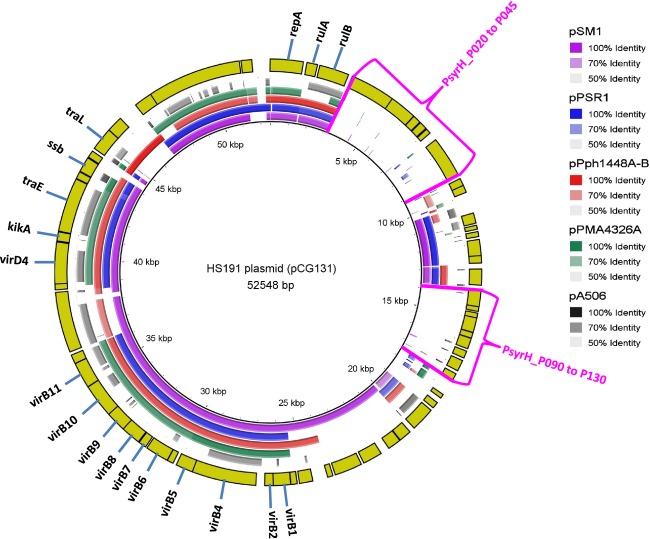
Figure 7.
Circular representation of plasmids from pathovars of Pseudomonas syringae against HS191 plasmid pCG131 using the BLAST Ring Image Generator (BRIG) software (Alikhan et al. 2011). The inner scales designate the coordinates in kilobase pairs (kbp). Ring 1 = P. syringae pv. syringae plasmid pSM1 (purple); Ring 2 = P. syringae pv. syringae plasmid pPSR1 (blue); Ring 3 = P. syringae pv. phaseolicola pPph1448A-B (red); Ring 4 = P. syringae pv. maculicola pPMA4326A (green); Ring 5 = Pseudomonas fluorescens pA506 (black); Ring 6 = coding DNA sequence (CDS) of HS191 plasmid (yellow). The areas in pCG131 not occurring in the four plasmids used for comparison are indicated by red brackets. Relative shading density (from darker to lighter) within each circle represents relative levels of nucleotide homology.

