
Figure 3.
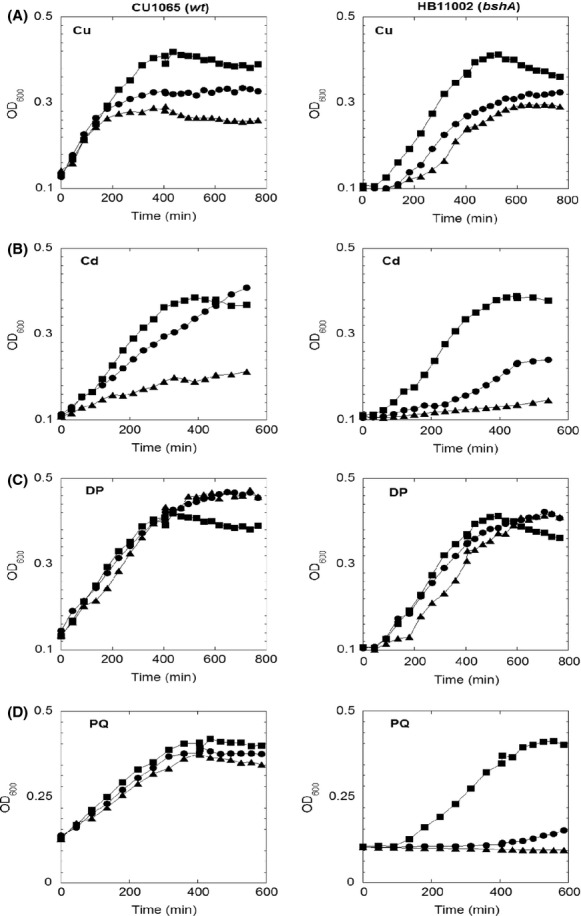
Growth curves of wild-type Bacillus subtilis (left panel) and ΔbshA strain (right panel) in MM with 0.05% casamino acid in presence of various stress challenges. (A) Cultures contained 0 μmol/L (square), 100 μmol/L (circle), and 300 μmol/L (triangle) of CuCl; (B) Cultures contained 0 μmol/L (square), 20 μmol/L (circle), and 50 μmol/L (triangle) of CdCl2. (C) Cultures contained 0 μmol/L (square), 100 μmol/L (circle), and 200 μmol/L (triangle) of 2,2′-dypridyl. (D) Cultures contained 0 μmol/L (square), 100 μmol/L (circle), and 250 μmol/L (triangle) of paraquat. The curves shown are representatives of at least three independent experiments.