
Figure 4.
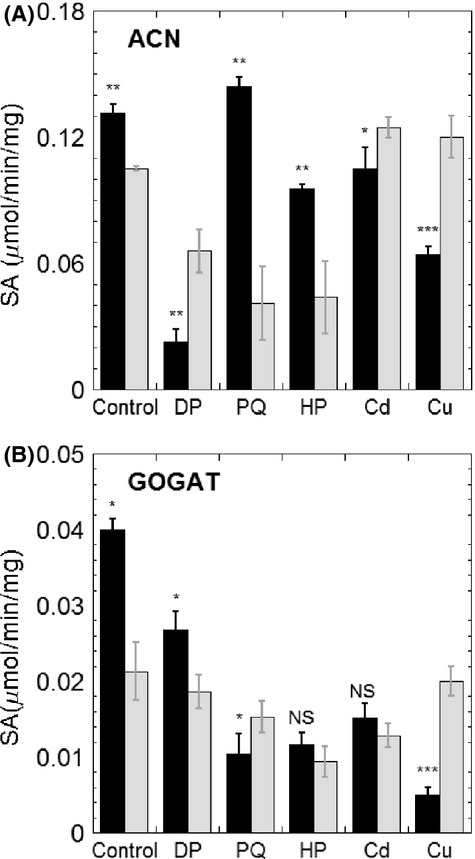
Specific activities of ACN (A) and GOGAT (B) under stress conditions. Cells were grown in MM to late log phase (OD600 of 0.8–1.0 measured with a 1 cm cuvette), at 37°C, and then 100 μmol/L of 2,2′-dypridyl (DP), 100 μmol/L of paraquat (PQ), 100 μmol/L of H2O2 (HP), 50 μmol/L of CdCl2 (Cd), or 100 μmol/L of CuCl (Cu) was added to challenge the cultures for 30 min. Cell lysates were prepared as described in Experimental Procedures. The wild-type strain is represented in black bars, whereas ΔbshA strain is shown in gray bars. All assays were repeated in triplicates. The statistical analysis was performed using unpaired t test, P values compare ΔbshA sample with wild-type sample (NS, not significant, *P < 0.05, **P < 0.01, ***P < 0.001).