
Figure 6.
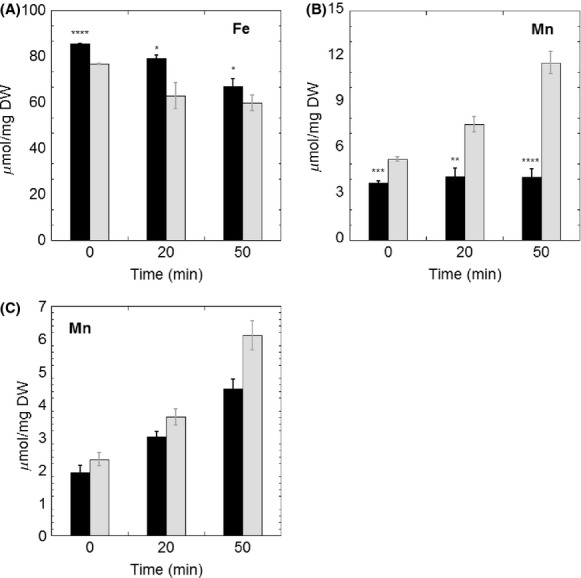
Total iron (A) and manganese (B) concentration analysis in wild-type Bacillus subtilis (black bar) and ΔbshA strain (gray bar) after exposure to 100 μmol/L of paraquat stress. All measurements were performed in triplicate from independent cultures. The statistical analysis was performed using unpaired t test, P values compare ΔbshA sample with wild-type sample (NS, not significant, *P < 0.05, **P < 0.01, ***P < 0.001, ****P < 0.0001). (C) Manganese distribution in ΔbshA strain under paraquat stress as shown labile (black bar) and protein-associated manganese (gray bar).