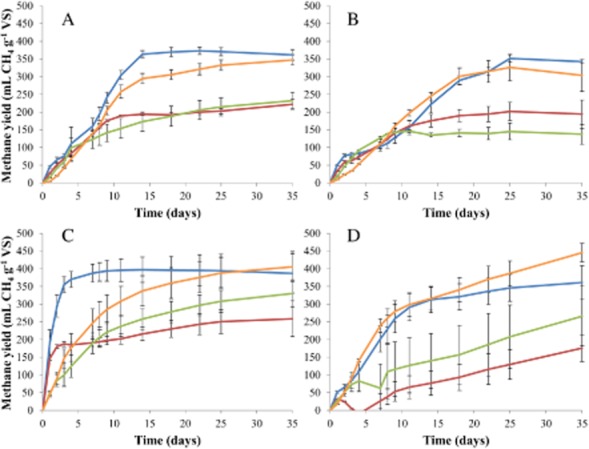
Figure 2.

Methane yield curves of the molasses ( ), bio-refinery waste (
 ), liquid manure (
 ), and A-sludge (
 ) substrates for the (A) OBW, (B) MAN, (C) BREW and (D) ENG inocula. Error bars show standard deviations.

Methane yield curves of the molasses ( ), bio-refinery waste (
 ), liquid manure (
 ), and A-sludge (
 ) substrates for the (A) OBW, (B) MAN, (C) BREW and (D) ENG inocula. Error bars show standard deviations.