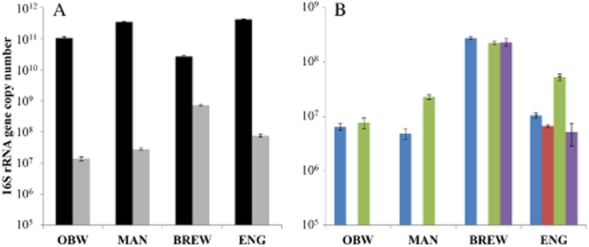
Figure 4.

Real-time PCR results of the microbial community in the different inocula, showing (A) total bacteria ( ) and total methanogens (
 ) and (B) the methanogenic populations Methanosaetaceae (
 ), Methanosarcinaceae (
 ), Methanobacteriales (
 ), and Methanomicrobiales (
 ). Error bars show standard deviations.
