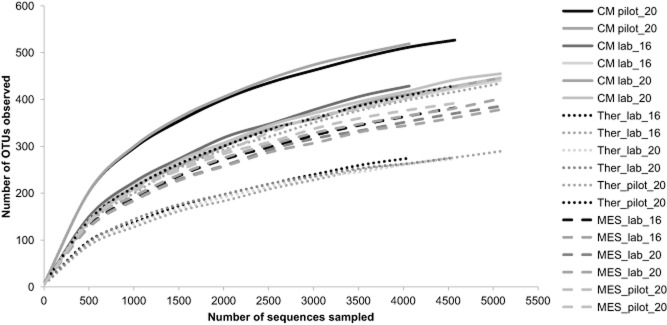
Figure 3.

Species accumulation (rarefaction) curves for all samples investigated (nine samples per duplicate), being: the three cattle manures used to feed the reactors in the three experimental periods: pilot-scale run with 20 days HRT (pilot_20), lab-scale run with 16 days HRT (lab_16) and lab-scale run with 20 days HRT (lab_20); and the reactor samples in each experiment obtained from the thermophilic (Ther) and the mesophilic (MES) reactors.
