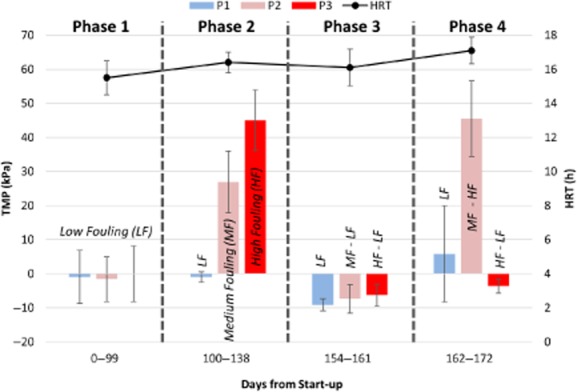
Figure 1.

Average transmembrane pressure (TMP) for each of the membranes P1, P2 and P3 (left y-axis) and bioreactor hydraulic retention time (HRT; right y-axis) from days 0 to 172. This time period is divided in four phases defined by the degree of membrane fouling or biofilm development. Data from days 139 to 153 are not reported due to poor AnMBR performance. Error bars for HRT represent the standard deviation of daily flow rate measurements. Error bars for TMP represent the standard deviation of pressure data recorded every minute of operation.
