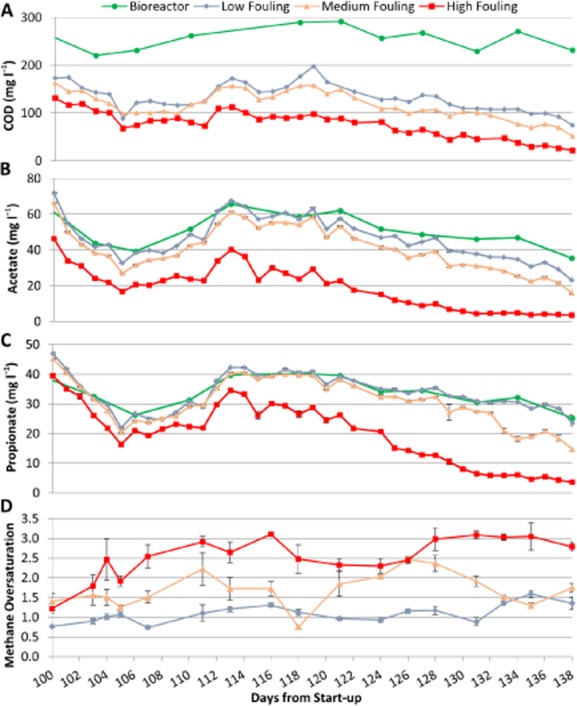
Figure 2.

Effect of different degrees of biofilm development (low fouling, medium fouling and high fouling) on permeate quality during Phase 2 of AnMBR operation.A. Bioreactor (soluble) and permeate COD concentrations. Influent COD was 410 ± 46 mg l−1.B. Bioreactor and permeate acetate concentrations. Error bars represent the standard deviation of triplicate IC injections.C. Bioreactor and permeate propionate concentrations. Error bars represent the standard deviation of triplicate IC injections.D. Dissolved methane oversaturation in the permeate calculated assuming a Henry’s law constant of 34 300 atm at 15°C (Tchobanoglous et al., 2003), and measured methane partial pressure in the biogas and dissolved methane concentration in the permeate. The methane content of the biogas was approximately 90%, with the balance being carbon dioxide. A high methane content is expected given the low organic loading rate and differences in methane and carbon dioxide solubility at this temperature. Error bars represent the standard deviation of duplicate dissolved methane extractions and triplicate GC injections of each dissolved methane extract.
