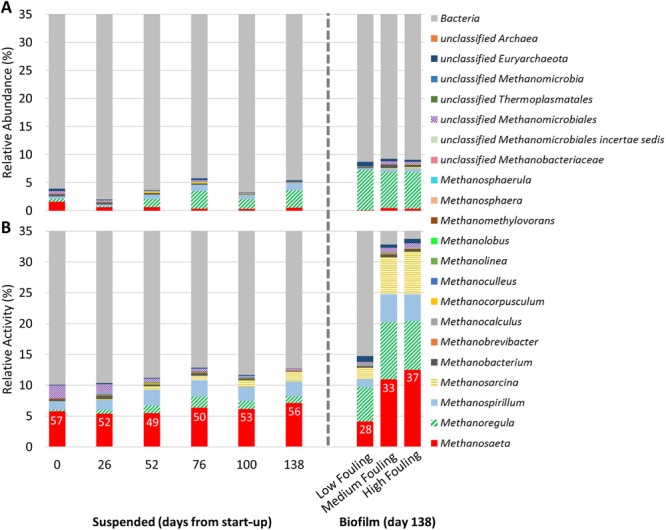
Figure 3.

(A) Relative abundance of methanogens identified at the genus level based on 16S rDNA sequencing and (B) relative activity of methanogens identified at the genus level based on 16S rRNA sequencing. Data were obtained for suspended biomass samples collected from start-up to the end of Phase 2 and in biofilm samples obtained at the end of Phase 2. Data are expressed as percentages and were normalized using the total number of 16S rDNA sequences (A) and 16S rRNA sequences (B) (including Bacteria and Archaea). Numbers within bars in (B) represent the relative activity of Methanosaeta spp. based on 16S rRNA sequence data normalized to the 16S rRNA sequences of all Archaea. A truncated y-axis (0–35%) is shown to accentuate changes in methanogen abundance and activity.
