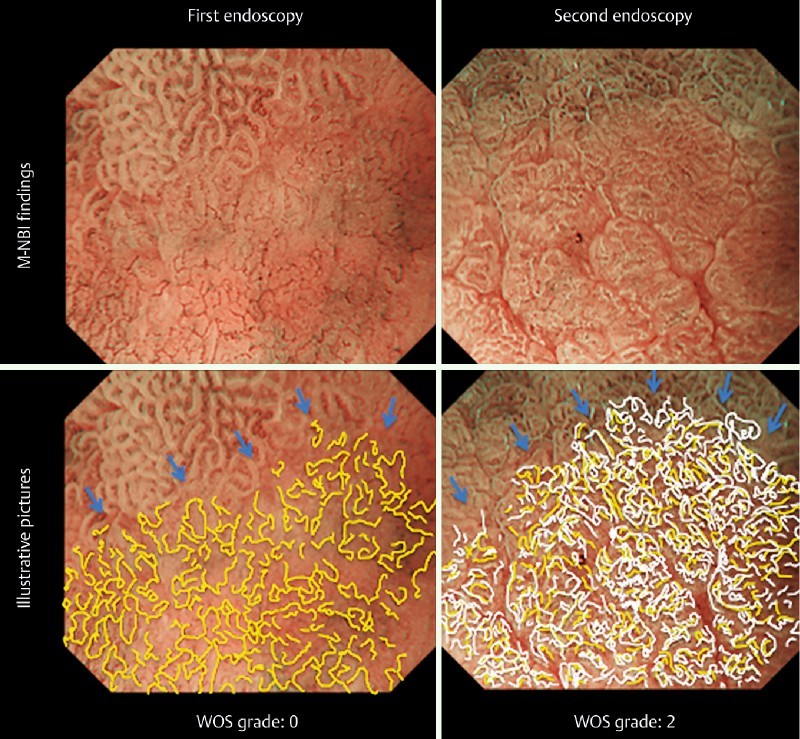
Fig. 3.

Results of magnifying endoscopy with narrow-band imaging (M-NBI) before and after the fat-loading test. An image from the first endoscopic examination is shown at the upper left, and an image from the second endoscopic examination is shown at the upper right. The microvascular architecture is traced with yellow lines at the bottom left, and the white opaque substance (WOS) is traced with white lines at the bottom right. It is obvious that the WOS density is increased after fat loading, obscuring the blood vessels.
