Abstract
Background
Although data from the Surveillance, Epidemiology, and End results (SEER)-affiliated cancer registry are accessible to the public, there is a shortage of published research describing cancer incidences for White, Black, and other residents in Georgia. The objective of this research is to provide an overview of the trends in incidence of cancer in Georgia.
Methods
Incidence data were obtained from the Surveillance, Epidemiology, and End Results (SEER) 9 program, supported by the National Cancer Institute, spanning the years 1982 to 2011. To assess trends over time, age-adjusted cancer incidence rates relative to the 2000 Standard US population and annual percent changes (APCs) were calculated using SEER*Stat software.
Results
In Georgia, cancer incidence rates for women increased from 365.1 per 100,000 in 1982 to 404.2 per 100,000 in 2011, with an overall APC of 0.3% (95% confidence interval: 0.2 to 0.4), but, for men, cancer incidence rates showed a slight decline from 528.0 per 100,000 in 1982 to 513.7 per 100,000 in 2011 (APC of 0.2%, 95% CI: −0.6 to 0.1). For Black, White, and Other (Asian/Pacific Islanders/American Indians) females, there were increases in incidence in this period, with APC values of 0.6, 0.4, and 0.3, respectively. For all males and for Black and White males, there were overall decreases in incidence, with APC values of −0.2. For Other males, however, the APC value was −0.9.
Conclusions
In Georgia, increases in cancer incidence rates occurred during 1982–2011 among the female population and within various racial groups in this population, but there was relative stability in incidence rates among the male population, except for Other males.
Keywords: trends, cancer incidence rates, SEER, annual percent changes (APC), Georgia
INTRODUCTION
Although data from the Surveillance, Epidemiology, and End results (SEER)-affiliated cancer registry are accessible to the public, there is a shortage of published research describing cancer incidences for White, Black, and other residents in Georgia (Wagner et al. 2012). Trends in prostate cancer incidence and mortality rates in Georgia have been reported (Berman et al, 1993; Wagner et al, 2012; Welton et al, 2015), but no literature has been published regarding the trends in overall cancer incidence rates in this state. The purpose of the present research was to investigate trends in cancer rates in Georgia as reported in the SEER registry for the period 1982–2011.
METHODS
Data
Incidence data are from the Surveillance, Epidemiology, and End Results (SEER) 9 program, supported by the National Cancer Institute, spanning the years 1982 to 2011. In relation to cancer incidence, SEER has population-based incidence data related to age, sex, race, and year of diagnosis at geographic (county) levels. The SEER 9 areas include approximately 10% of the US population based on the 2010 census and cover nine different registries: Atlanta, Georgia; San Francisco-Oakland, California; Connecticut; Detroit, Michigan; Iowa; Hawaii; New Mexico; Utah; and Seattle-Puget Sound, Washington. The SEER 9 data cover more years (1973 through 2011) but have a smaller geographic coverage relative to that in SEER 13 and SEER 18 data. The SEER 13 data cover approximately 13.4% of the US population, including four additional areas (San Jose-Monterey, Los Angeles, Alaska Natives, and Rural Georgia) relative to the SEER 9 data. The SEER 18 data include five more areas: Greater California, Kentucky, Louisiana, New Jersey, and Greater Georgia. However, the SEER 13 (1992–2011) and SEER 18 (2000–2011) data have fewer years relative to the SEER 9 (1973–2011). In the present effort, cancer incidence rates and 95% confidence intervals (CIs) were calculated as cases per 100,000 persons and age-adjusted to the 2000 US standard population using SEER*Stat software (http://seer.cancer.gov/seerstat/). The 2000 US standard million population was used. This research involved analyses of existing, publicly available data and did not require review from any Institutional Review Board.
Statistical Methods
Annual percent changes (APCs) were calculated by least-squares linear regressions on the natural logarithm of the annual age-adjusted rates to characterize trends in cancer incidence rates over specified periods of time (by the ten-year periods of 1982–1991, 1992–2001, 2002–2011, and by a thirty-year period, 1982–2011 (Kim et al. 2001). APCs and corresponding 95% confidence intervals were calculated for the overall populations, by gender, and by racial groups.
Testing the hypothesis that the APC is equal to zero is equivalent to testing the hypothesis that the slope of the line in the regression is equal to zero. The statistical significance in differences between two APCs was tested using t-statistics with degree of freedom defined as the sum of the number of years in both time periods minus four at 5% of significance level. Statistical analyses were performed with the use of SAS statistical software, version 9.3 (Statistical Analysis Software Institute, Cary, NC) and R software (version 3.2, www.r-project.org).
RESULTS
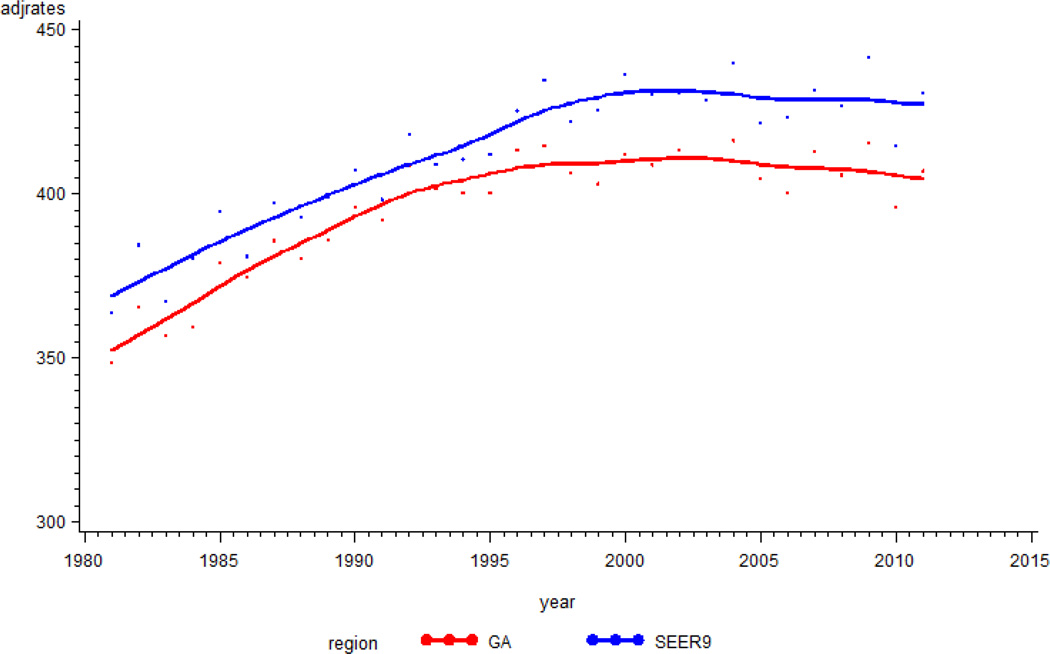
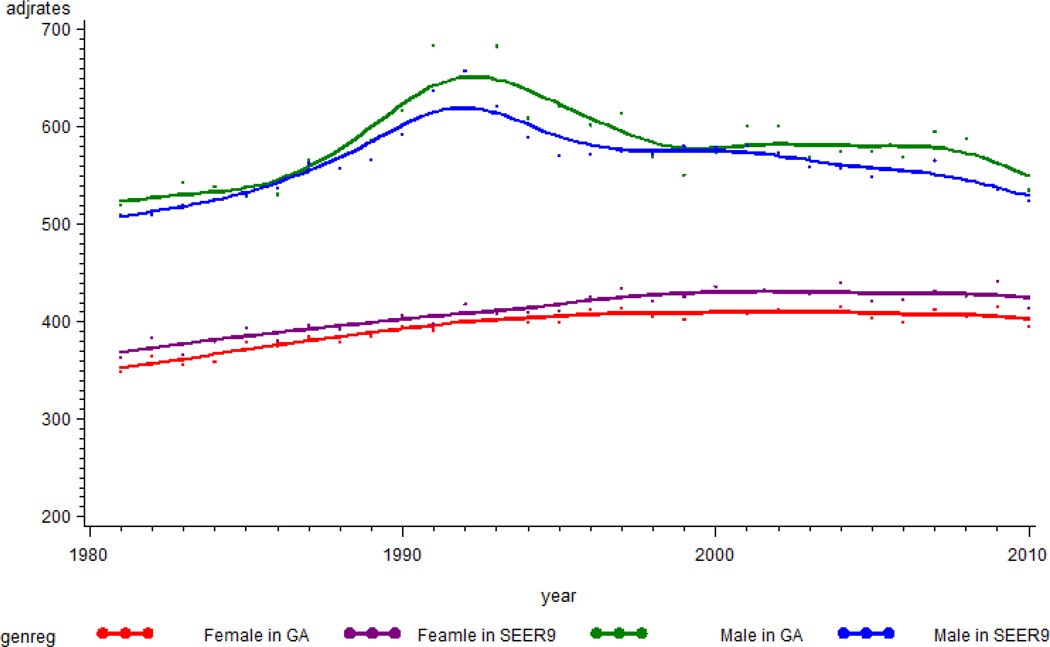
The trajectories of cancer incidence rates (cases/100,000) were examined for Georgia and for the SEER9 areas. The rates rose progressively until 2004 (416.4 in Georgia and 440.2 in SEER 9 areas), then showed a small decreasing trend (Figure 1). Cancer incidence rates for Georgia were, on average, lower by about 15/100,000 than those for SEER 9 areas. Figure 2 shows trajectories of cancer incidence rates for females and males. For the entire period, the average incidence rates were 390.2, 405.8, 573.7, and 554.8 for females in Georgia, females in SEER9 areas, males in Georgia, and males in SEER9 areas, respectively. After 1993, incidence rates for males in Georgia and SEER9 areas showed decreasing trends. The SEER9 incidence rates for males decreased steadily, but the rates for males in Georgia had a slower decrease. For both Georgia and the SEER9 areas, the cancer incidence rates for females increased prior to about 2000; after that time, the values remained steady.
Figure 1.
Trajectory of incidence rates for cancer in Georgia and in SEER 9 areas. The Y-axis is incidence rates per 100,000, and the x-axis is year of diagnosis.
Figure 2.
Trajectory of incidence rates for cancer by gender in Georgia and in SEER 9 areas. The Y-axis is incidence rates per 100,000, and the x-axis is year of diagnosis.
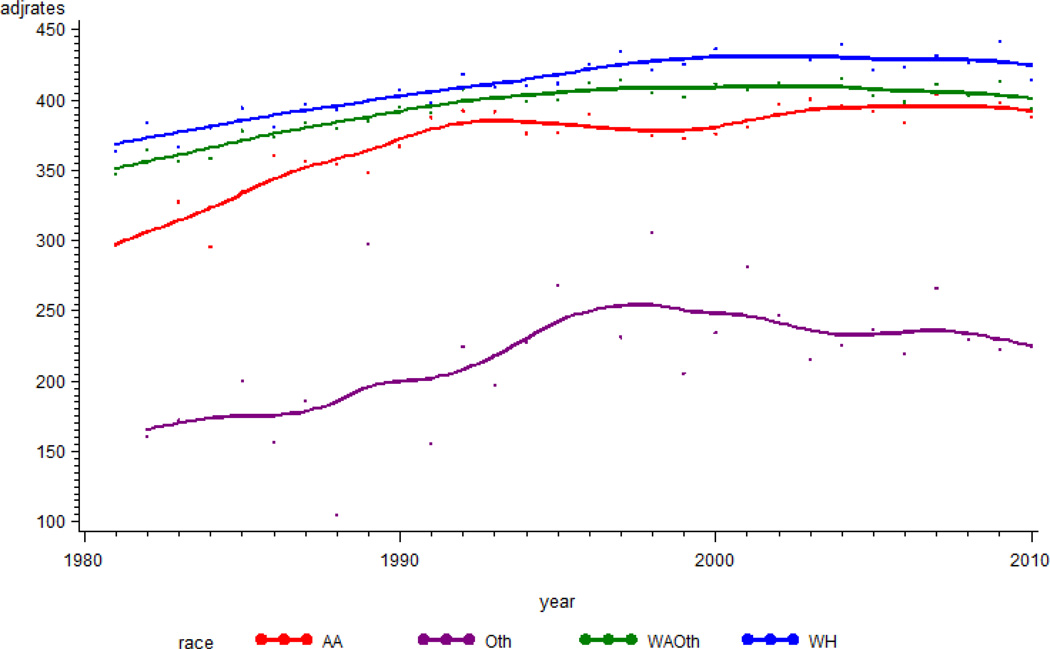
Trends in cancer incidence rates among race-specific sub-groups were also investigated. SEER reports race-specific cancer incidence in the categories White, Black, and Other. The Other group includes Asian, Native American, and Pacific Islanders. The White female group showed high cancer incidence rates relative to Black and Other females (Asian/Pacific Islanders/American Indians) (Figure 3). The cancer incidence rates for the Other race group were low relative to those for Whites and Blacks. In general, the trajectories for cancer incidence increased until about 2004 and remained steady afterward.
Figure 3.
Trajectory of incidence rates for cancer by race in Georgia. The Y-axis is incidence rates per 100,000, and the x-axis is year of diagnosis.
Absolute and relative changes in cancer incidence in Georgia by sex and race for the years 1982, 1992, 2002, and 2011 were examined (Tables 1 and 2). During this period, cancer incidence rates for women increased significantly from 365.1 per 100,000 in 1982 to 404.2 per 100,000 in 2011, with an annual percent change (APC) of 0.3% (95% confidence interval: 0.2 to 0.4). For the male population, however, the cancer incidence rate in 2011 was similar to that in 1982, with a slight decline from 519.6 per 100,000 in 982 to 513.7 per 100,000 in 2011 (APC of 0.2%, 95% CI: −0.6 to 0.1). For men, the overall trends of cancer incidence rates did not substantially increase or decrease. For both female and male populations, nevertheless, data for the three time-segment periods (1982 to 1991, 1992 to 2001, and 2002 to 2011) showed up-and-down trends.
Table 1.
Age-adjusted incidence rates for cancer in Georgia by sex and race
| Cancer incidence Age-adjusted rate per 100,000 individuals |
|||||
|---|---|---|---|---|---|
| 1982 | 1992 | 2002 | 2011 | ||
| Female | All | 365.1 | 408.1 | 412.3 | 404.2 |
| Black | 306.0 | 392.8 | 397.4 | 395.2 | |
| White | 384.6 | 418.4 | 430.8 | 431.1 | |
| Other | 160.6 | 224.9 | 246.9 | 215.8 | |
| Male | All | 528.0 | 717.4 | 600.8 | 513.7 |
| Black | 596.4 | 803.3 | 674.1 | 562.9 | |
| White | 513.4 | 703.0 | 595.2 | 513.5 | |
| Other | 354.9 | 321.0 | 259.2 | 256.6 | |
Table 2.
Annual percent change in cancer incidence rates in Georgia stratified by sex and race
| Cancer incidence Annual percent change (APC) |
|||||
|---|---|---|---|---|---|
| 1982–1991 | 1992–2001 | 2002–2011 | 1982–2011 | ||
| Female | All | 1.0* | 0.2 | −0.3 | 0.3* |
| Black | 2.4* | −0.4 | −0.1 | 0.6* | |
| White | 0.8* | 0.6* | −0.1 | 0.4* | |
| Other | 3.7 | 1.8 | −0.7 | 0.3 | |
| Male | All | 2.6* | −2.1* | −1.2* | −0.2 |
| Black | 2.1* | −1.9* | −1.7* | −0.2 | |
| White | 2.7* | −2.1* | −1.0* | −0.2 | |
| Other | 2.2 | −1.9 | −1.0 | −0.9 | |
The APC is significantly different from zero (p-value is less than <0.05%)
During the sub-segment period of 1982 through 1991, the cancer incidence rates increased from 365.1 to 408.1, with an APC of 1.0% (95% CI: 0.6 to 1.4) for the female population and from 528.0 to 717.4 with an APC of 2.6% (95% CI: 1.3 to 3.8) for the male population. In the time-segments of 1992–2001 and 2002–2011, cancer incidence rates for males decreased, but rates for females tended to increase and then to decline slightly during the most recent ten-year period. For Black women, rates increased overall with an APC of 0.6% (95% CI: 0.4 to 0.7); an APC of −0.2% for Black men was not statistically significant. Similarly, rates for White women increased overall with an APC of 0.4% (95% CI: 0.3 to 0.6); an APC of −0.2% for White men was not statistically significant. The last time segment (2002–2011) showed decreasing trends for both genders and all races, with an APC of −1.2% for males (95% CI:−2.0 to −0.3) but a statistically insignificant APC of −0.3% for females (95% CI: −0.7 to 0.1).
DISCUSSION
Among the population in Atlanta, Georgia, and the SEER 9 areas, the cancer incidence increased until the mid-2000s, but there was a small, steady decline in the incidence rates afterwards. Gender-specific analyses show that trajectories for males declined sharply after the early 1990s, then had a small, steady decline after 2000. Race-specific analyses indicated that White women and men had high incidences of cancer, and the Other race group had a lower cancer incidence relative to Whites and Blacks.
Monitoring cancer trends is a function of cancer surveillance systems. Changes in the occurrence of cancer in a population often lead to research on potential for changes in cancer rates. Monitoring cancer trends allows evaluation of the efficacy of cancer screening or detection methods and, thereby, determination of priorities in cancer control programs. Government officials and policy makers also use information on cancer trends to allocate resources for cancer research and prevention.
The cancer incidence trends identified in this analysis likely reflect societal influences. The flattening of the upward incidence trajectory starting in the mid-1990s is likely the result of the decrease in smoking rates that began in the mid-1960s. The increased slope of the incidence curve for men, but not women, beginning in the mid-1980s and reversing in the early 1990s reflects the classic pattern that follows the introduction of a new screening program -- in this case, widespread screening for prostate cancer.
Caution is required in interpreting these results since the SEER data were derived from only 9 areas, which represent about 10% of the US population, and, for Georgia, the data are limited to the Atlanta area and do not include rural areas.
The SEER 9 data are not independent of Hispanic ethnicity because it does not contain information on Hispanic ethnicity like the SEER 13 and SEER 18 databases. Thus, it would be appropriate to compare the results with those from SEER 13 and SEER 18 data. A non-statistically significant decrease in cancer incidence rates among persons of the Other race group may reflect an insufficient sample size, leading to a lack of sufficient power. Even though the APCs for the Other groups do not show statistical significance, the trajectories show up-and-down trends during the individual time periods.
The risk of cancer can be influenced by a combination of environmental, genetic, and behavioral factors. With the Georgia Department of Public Health (GDPH), the Georgia Cancer Control Consortium issued the second edition of Georgia’s Comprehensive Cancer Control Plan (2014–2019), which focuses on reducing the risk of cancer (Prevention), detecting cancer earlier (Detection), improving diagnosis and treatment (Diagnosis and Treatment), and enhancing survivorship. Survivorship can be increased through advances in cancer diagnosis and treatment and by building strong cancer prevention and control programs.
Acknowledgements
This research was supported by the National Cancer Institute (5R01CA166785 and 2U54 CA118638) and the National Institute on Minority Health and Health Disparities (U54MD008149).
References
- American Cancer Society. Cancer Facts & Figures 2015. Atlanta: American Cancer Society; 2015. [Google Scholar]
- Berman IR, Ulcickas M, Yood SM, Grant RL. Cancer trends unique to Georgia. J Med Assoc Ga. 1993;82(1):29–31. [PubMed] [Google Scholar]
- Georgia Cancer Control Consortium. Georgia Cancer Plan 2014–2019. Georgia Department of Public Health. 2014
- Kim HJ, Fay MP, Feuer EJ, Midthune DN. Permutation tests for joinpoint regression with applications to cancer rates. Stat Med. 2000;19(3):335–351. doi: 10.1002/(sici)1097-0258(20000215)19:3<335::aid-sim336>3.0.co;2-z. correction: 2001;20(4):655. [DOI] [PubMed] [Google Scholar]
- Wagner SE, Hurley DM, McNamara C, Bayakly AR, Vena JE. Cancer mortality-to- incidence ratios on Georgia. Cancer. 2012;118:4032–4045. doi: 10.1002/cncr.26728. [DOI] [PMC free article] [PubMed] [Google Scholar]
- Welton M, Robb SW, Shen Y, Guillebeau P, Vena J. Prostate cancer incidence and agriculture practices in Georgia, 2000–2010. Int J Occup Environ Health, 2015. 2015 Mar 18; doi: 10.1179/2049396714Y.0000000106. 2049396714Y0000000106. [Epub ahead of print] [DOI] [PMC free article] [PubMed]


