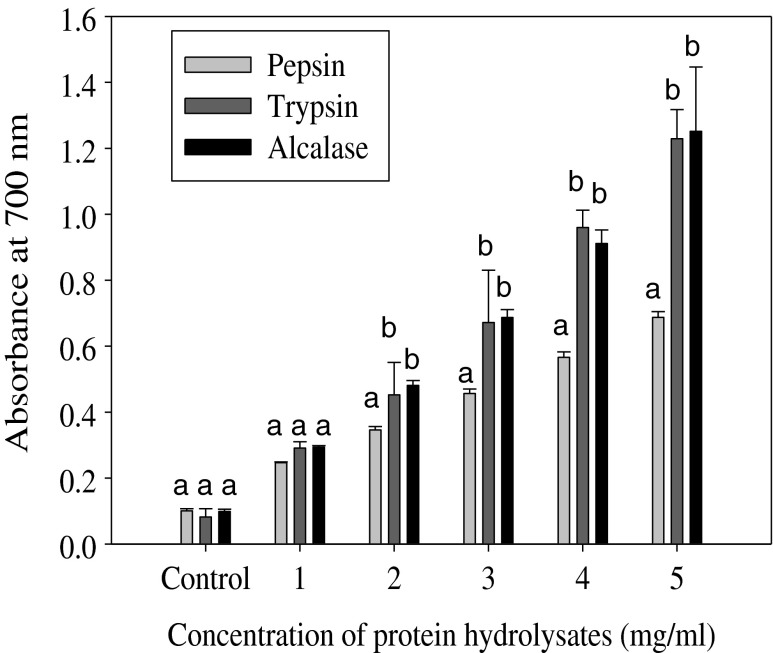
Fig. 2.
Ferric (Fe3+) reducing power of carp roe protein hydrolysates measured by the ability to donate electrons and reduce Fe3+to Fe2+ ions. The formation of Fe2+/ferricyanide complex was measured as the absorbance at 700 nm. The increasing absorbance at 700 nm indicates increasing reducing power. Different superscript letters (a, b, c) on same concentration of the three hydrolysates indicate significant difference at P < 0.05

