Abstract
Coffee is known throughout the world for its distinct aroma and flavour which results from a number of volatile compounds present in it. It is very difficult to arrest the aromatic compounds once the roasting process is complete and it becomes even more challenging to store the beans for a longer time with the retained volatiles as these compounds are easily lost during industrialized processing such as the grinding of roasted coffee beans and storage of ground coffee. Thus, an attempt was made to minimise the loss of volatile from roasted coffee beans by coating with Carboxymethyl cellulose (CMC), Hydroxypropylmethyl cellulose (HPMC) and Whey protein concentrate. Coffee volatiles were analysed by Gas chromatography and 14 major compounds were identified and compared in this study. Results showed an increase in the relative area of major volatile compounds in coated roasted coffee beans when compared with unroasted coffee beans for consecutive two months. Moreover, effect of coating on textural properties and non-volatiles were also analysed. The results have indicated that edible coatings preserve the sensory properties of roasted coffee beans for a longer shelf life and cellulose derivatives, as an edible coating, exhibited the best protecting effect on roasted coffee beans.
Keywords: Coffee beans, Roasting, Edible coating, Preservation, GC, Simultaneous distillation Extraction (SDE)
Introduction
Coffee, a dark brown drink, prepared from the roasted or baked seeds of several species of an evergreen shrub of the genus Coffea, is known throughout the world for its distinct aroma. Coffee is the second most sold commodity around the world, after oil (Fitter and Kaplinksy 2001). Coffee has been consumed for over 1,000 years and today, it is considered to be the most consumed drink in the world (more than 400 billion cups yearly) (Sobésa 2008). The main producers of coffee in the world are Brazil followed by Veitnam, Columbia, Indonesia, Ethiopia, and India (International Coffee Organization ICO 2014). The total coffee production has increased from 128,636,000 bags from 2008 to 145,775,000 bags in 2013. The characteristic flavor and richness of coffee aroma makes it a unique beverage, with almost a thousand volatile compounds identified in roasted coffee (Yeretzian et al. 2003). Varying the roasting time has a significant effect on the flavour, aroma, and colour of the brewed coffee. An international group of scientists has reported that inhaling the rich, warm aroma of a hot cup of coffee may alters the activity of some genes in the brain, reducing the effects of sleep deprivation (Hindmarch et al. 2000). Spouted bed roasting (SBR) technology which operates on the principle of high temperature short time processing is used for roasting of coffee beans (Nagaraju et al. 1997). There is very good mixing of solids and effective gas-particle contact in SBR which facilitates HTST (High Temperature Short Time) processing and provides clean uniformly roasted products (Nagaraju and Ramalakshmi 2002). The optimized combinations of temperature and time of roasting considered were 237–250 °C and 180–240 s respectively, considering the brightness and maximum force of samples (Nagaraju and Bhattacharya 2010). Moreover, fast roasting is reported to result in higher amount of soluble solids, less degradation of chlorogenic acids, lower loss of volatiles, and lesser burnt flavor (Nagaraju et al. 1997). Roasting green coffee beans in the spouted bed roaster led to marked change in color and texture of products (Nagaraju and Bhattacharya 2010). Excessive roasting produces more bitter coffee that lacks satisfactory aroma, whereas very short roasting time may be considered as insufficient to develop full organoleptic characteristics (Buffo and Cardelli-Freire 2004). The formation of color and flavor producing compounds is accompanied by a large increase in bean volume and changes in ultrastructure of both the cell wall and the cytoplasm of the green bean (Schenker et al. 2000). The characteristic aroma of coffee is developed during roasting of green beans which involves exposing the coffee beans to a warming process that is sufficient enough for driving off the free and bound moisture content. The roasting process can be divided into three phases as drying of moisture from beans, pyrolytic reactions for aroma release and final cooling phase to stop exothermic reactions (Buffo and Cardelli-Freire 2004). Thus, coffee aromatic compounds are formed by the reactions that occur during roasting such as Maillard reaction, Strecker degradation, and degradation of sugar and breakdown of amino acids (Makri et al. 2011). The aroma of roasted and ground coffee is critical to consumer liking (Denis Fisk et al. 2012). The unique aroma profiles of coffee are closely related to the time-temperature profile used during roasting. (Illy and Viani 1995) listed some chemical processes that affect the development of volatile compounds in coffee such as Maillard reaction, Strecker degradation, amino acid degradation, degradation of trigonelline, sugars, phenolic acids and interaction between the decomposition products formed by these reactions. More than 800 volatile compounds have already been identified in roasted coffee, among which, about 40 compounds such as hydrocarbons, alcohols, aldehydes, ketones, acids and anhydrides, esters, lactones, phenols, furans and pyrans, thiophenes, pyrroles, oxazoles, thiazoles, pyridines, pyrazines, and other nitrogenous and sulfurous compounds (Grosch 2001) are responsible for the characteristic aroma of coffee (Belitz et al. 2009). No previous study has been done on coating of roasted coffee beans thus, the edible coatings should be selected in a way that they should retain the original taste, texture, and appearance of the product, and should be categorised as GRAS (Generally Regarded as Safe). It is estimated that the thickness of the coating should not exceed 0.3–0.4 mm, or the tongue will be able to detect it (246th National Meeting & Exposition of the American Chemical Society). The effectiveness of a polymer or edible films as an aroma barrier can be described by its diffusion, solubility, and then permeability coefficients (Fabra et al. 2008).
In this work, an attempt has been made to preserve the major volatiles and sensory attributes of roasted coffee beans so as to achieve the maximum aroma and taste during consumption. Some carbohydrate and protein edible coatings have been applied to the roasted coffee beans in order to restrict the escape of aromatic substances in the environment and would be released as the result of disruption (through grinding or increased temperature) or dissolving into a liquid.
Materials and methods
Materials
Peaberry (raw) coffee beans were procured from local market of Mysore, India. Carboxymethyl Cellulose (Sodium salt), Hydroxypropylmethyl Cellulose were procured from Thermofishers Scientific, Hyderabad, India and whey protein concentrate (with 89–90 % protein content) was procured from Pristine Organics, Bangalore, India. Solvents used were of HPLC grade and were provided by Lobal Chemie, Mumbai, India.
Roasting and coating of coffee beans
The raw green beans of peaberry coffee were roasted at 230–235 °C for 20–25 min in Spouted Bed Roaster developed by CSIR-CFTRI, Mysore (Nagaraju et al. 1997). The edible coating materials used was carboxymethyl cellulose (CMC), hydroxypropylmethyl cellulose (HPMC) and whey protein concentrate (WPC). The concentrations used for preparation of coating material were optimized on the basis of viscosity of the coating material and some initial trials (with different concentrations) which included a further GC analysis of the samples for a better optimization. All the analysis was compared with Control (uncoated roasted coffee beans). Thus, systems studied were: a) CMC b) HPMC c) WPC and d) Composite coating of WPC and CMC. Pranoto et al. 2009 also studied the effect of Methylcellulose and hydroxyprophyl methylcellulose-based coatings on partially defatted peanut.
The coating of coffee beans was done in a coating pan (Ekneet and Bodhisattwa 2011), revolving at a constant speed and a maintained temperature of 70–80 °C, so that simultaneous drying of beans is also initiated forming a continuous film on the surface of beans. A spray assemble connected to a compressor was used for spraying of coating solution.
Preparation of coating solution
1.5 % (w/v) solution of CMC was prepared in sterile triple distilled water, followed by stirring until the powder was wetted and a consistent dispersion was obtained. The solution was then allowed to equilibrate to room temperature. Then, glycerol was added as a plasticizer (1.9 %) and the solution was stirred for another 10 min and cooled. 150 mL of CMC solution was used for coating of 500 g coffee beans.
Similarly, 2.5 % (w/v) solution of HPMC was prepared by dispersing 2.5 g of HPMC powder in 100 mL of sterile triple distilled water followed by addition of 1.9 % glycerol and stirring at constant intervals until the powder was wetted and a consistent dispersion was obtained. 100 mL of this solution was then used for coating of 500 g roasted coffee beans.
Whey protein solution was prepared at 15 % (w/v) in triple distilled water and then homogenizing for 10 min using a homogenizer at 2,000 rpm. 2 mL glycerol as a plasticizer was added. Then 75 mL of this solution was used for coating of 500 g roasted coffee beans.
For a composite coating preparation, 15 % (w/v) WPC was used as a first coat followed by a second coat of 50 mL solution of 1.5 % CMC solution. Then, 75 ml of this solution was used for coating 500 g of roasted coffee beans.
Texture analysis of coated roasted beans
In texture analyser (Lloyd Instruments Ltd, UK), compression testing was done where a probe was allowed to moved down slowly at pre-test speed until a threshold value (the trigger) has been reached. The probe then moved at a set distance at a set speed into the sample material that was placed (or fixed) on the base table of the instrument. The load was continuously monitored as a function of both time and distance until the probe again returned to its starting position. Each sample was repeated five times.
Scanning electron microscopy of coated coffee beans
Scanning electron microscopy of the films was performed with a Leo 435 VP, (Leo Electron Microscopy Ltd, Cambridge, UK) electron microscope. Pieces of coffee beans were mounted on aluminium stubs using a double-sided tape and then coated with a layer of gold (30 A°), to make the sample conductive, allowing surface and cross-section visualization. All samples were examined using an accelerating voltage of 15 kV. Microphotographs were taken at magnifications of 500x.
Particle size analysis of coating material
The coating material was tested for particle size in a particle size analyzer (Zetatrac, Microtrac). Samples were added in sample holder, till it reaches its loading range and particle size distribution was determined with the velocity distribution of particles, suspended in a dispersing medium, using the principles of dynamic light scattering. All analysis was performed in triplicates.
Preliminary analysis of coffee volatiles by electronic nose
Electronic Nose (E-Nose) consists of a sampling system (for a reproducible collection of the mixture), an array of chemical sensors, electronic circuitry, and data analysis software (Gardner and Bartlett 1999). For analysis, 2 g samples of each coated and uncoated roasted coffee beans were taken in small vials which were crimped with seal and septa in a way that it filled 1/4th of the volume. Then, the apparatus (α-Fox 4,000, Alpha MOS Company, France) was switched on and pure air was run for 2 hrs to optimize the conditions through all the triple set of six sensors. After calibration, headspace air was collected in the injection and injected in the port. This method was repeated five times for each sample.
Sample preparation for volatile analysis by GC
A Simultaneous Distillation Solvent Extraction (SDE) was carried out using Likens–Nickerson apparatus. 30 g sample of ground coffee with 1,000 mL distilled water was placed in 2 L round bottle flask at one end of the apparatus, while the other end was fitted with a 250 mL round bottle flask containing 50 mL dichloromethane (DCM). Apparatus was connected to a chiller at 10 °C. Coffee sample was heated at 90–100 °C while DCM was set at 40–50 °C and process was continued for 3 hrs. Collected volatiles in DCM were then concentrated to 1 mL and used for GC injection.
GC analysis of volatiles
Volatile concentrates were analyzed using Perkin Elmer, Clarus 580, (USA) Gas Chromatograph for a capillary column Elite 5 (Crossbond® 5 % diphenyl- 95 % dimethyl polysiloxane; Perkin Elmer, USA) and Flame ionization detection (FID) system. 1 μL samples were injected. The chromatograph was operated using programmed temperature ramps with the following conditions: initial temperature, 40 °C; hold time, 5 min; ramp, 0.5 °C/min up to 60 °C; ramp, 5 °C/min up to 180 °C; hold time, 1 min. The carrier gas used was nitrogen at the flow rate of 40 mL/min. The temperature of the injector and detector was 210 and 220 °C, respectively.
Identification of volatile compounds and quantitative measurements
Volatile compounds of coffee were identified by comparing the retention times with those of reference standards, and based on the comparison of their mass spectra with library spectra (NIST/EPA/NIH, 1995). Then, the quantification was done by comparing the relative area peaks. A mixture of standard hydrocarbons was dissolved in acetone and injected into GC-MS (Perkin Elmer, USA) following the same protocol as GC. Volatile components were identified by comparisons with the Kovats gas chromatographic retention index and MS fragmentation pattern of authentic chemicals. Thus, based on the Kovats index and mass spectra of sample, the maximum hits given were compared with the mass spectra of the related compounds from NIST and Wiley library.
FTIR analysis of non-volatiles of coffee
Control (roasted and uncoated) and coated coffee samples were ground and mixed with 100 mg of FTIR grade KBr and pelletized i.e., pressed into pellets under mechanical pressure. The FTIR spectrum was recorded at 400–4,000 cm–1 at room temperature in FTIR Nicolet Magna 5,700 spectrophotometer (Thermo electron Inc., NICOLET 5,700, FT –IR, USA).
Results and discussion
Texture analysis
An average compression load and a maximum compression load was calculated for each coffee bean type and it was found that maximum compression load was increasing in the coated beans as compared to the uncoated beans. This result showed that coating material was increasing the durability of the coffee beans and thus its breakage due to mechanical shearing can be prevented. The samples were tested five times for each type and an average value was calculated as given in Table 1, which shows the maximum compression load for each bean type from a constant height of 6.35 mm. The data from the Table 1 depicts that more compression load is required for breaking the composite coated coffee beans, followed by CMC, HPMC, and WPC coated beans. Hence, the hardness of the coffee beans has increased with a uniform coating layer over them. Jokanovića et al. 2012 had also studied the effect of roasting on the physical properties of coffee beans and investigated the effects of heating time on weight, volume, texture, and colour of coffee beans. They predicted the moisture content, and density changes as the main factors that affect the mechanical properties of coffee beans during roasting.
Table 1.
Average Maximum load (N) for all the coated and uncoated (control) coffee beans at a constant height of 6.35 mm
| Control | Composite | CMC | HPMC | WPC | |
|---|---|---|---|---|---|
| Maximum | 32.635 | 118.664 | 126.200 | 55.993 | 39.187 |
| Load (N) | 33.935 | 118.085 | 133.906 | 43.228 | 43.214 |
| 36.996 | 128.694 | 129.680 | 63.926 | 35.052 | |
| 36.489 | 128.602 | 122.132 | 48.086 | 40.072 | |
| 31.503 | 139.901 | 125.156 | 47.516 | 51.944 | |
| Average | 34.311 ± 2.38 | 128.189 ± 7.653 | 127.415 ± 4.520 | 51.750 ± 8.21 | 41.894 ± 5.66 |
Scanning electron microscope
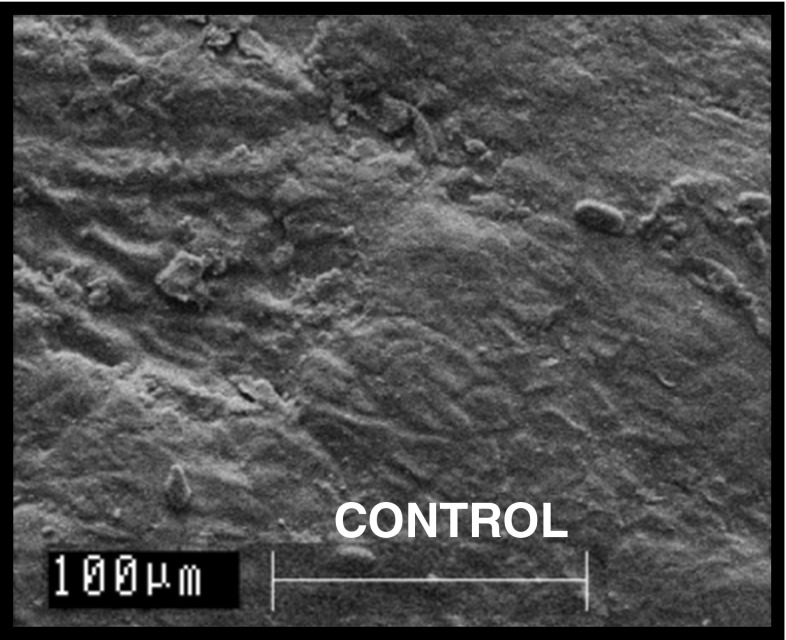
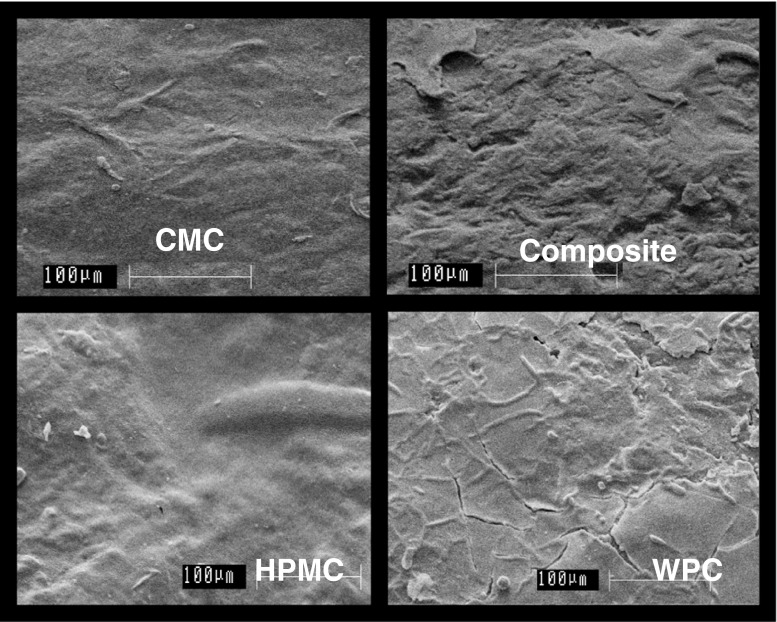
SEM micro-images showing the surface morphology of uncoated roasted coffee beans obtained is represented in (Fig. 1) while that of the coated roasted beans is shown in (Fig. 2). The comparative study of different coated beans at magnification of 500x showed some crevices and peeling off of coating material in case of WPC coated film which formed on the surface of roasted coffee beans while the layer was comparatively intact in CMC and HPMC coated coffee beans. Some bruises or bumps were observed in the case of composite coating, but from the microimages it was found to be in comparison with the control because roasting of coffee beans causes the surface uneven and porous forming it non-uniform which made the coating to peel off from some regions. Moreover, WPC solution used for coating of coffee beans had a very less viscosity as compared to the CMC and HPMC solutions because of which it may have been difficult for the WPC molecules to retain on the surface of the coffee beans as the beans are of porous nature (Schenker et al. 2000) with oil sweating surface.
Fig. 1.
SEM image of uncoated coffee bean at 500x magnification
Fig. 2.
SEM image of coated coffee beans surface at 500x magnification showing Carboxymethyl Cellulose (CMC) coated surface, Composite coated surface, Hydroxypropylmethyl Cellulose (HPMC) coated surface and Whey protein concentrate (WPC) coated surface of roasted coffee beans
Particle size analysis of coating materials
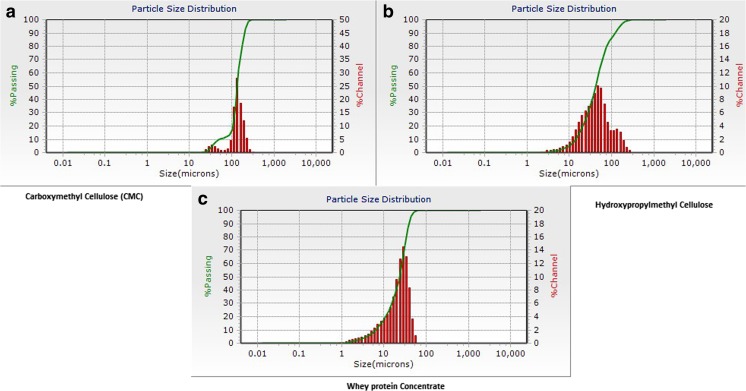
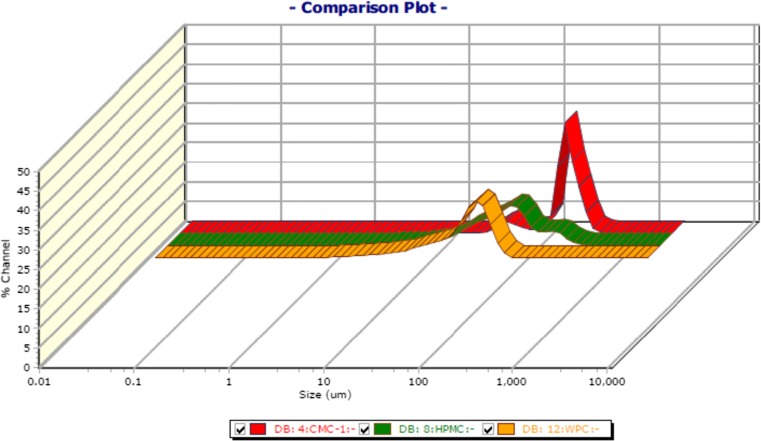
The average particle size as determined by Zetatrac particle size analyzer gives the following results as shown in Table 2 and the bell- shaped curve obtained by the analysis is shown in Fig. 3. The particle size value that was obtained at the peak point of bell shaped curve was considered for the analysis as an average value of size of the particles present in the solution. Figure 4 shows a comparison plot of particle sizes for all the three solutions giving a relative graph of varying ranges of particle sizes. CMC particles lie in the size range of 100–200 μm, HPMC has a particle size range of 10–100 μm while WPC has a range of 10–60 μm. Thus, it shows that the particle size is ranging maximum for CMC while the particle size range for WPC is the minimum.
Table 2.
Showing particle size of coating material calculated at 50 percentile
| S. No | Coating material | Particle size (μm) |
|---|---|---|
| 1. | Carboxymethyl cellulose | 136.6 ± 40.61 |
| 2. | Hydroxypropylmethyl cellulose | 42.41 ± 35.37 |
| 3. | Whey protein concentrate | 23.12 ± 13.22 |
Fig. 3.
Particle size analysis showing bell-shaped graph for (a) CMC (b) HPMC and (c) WPC
Fig. 4.
Showing comparison plot of particle size for CMC, HPMC and WPC
Preliminary analysis of aroma compounds by E-nose
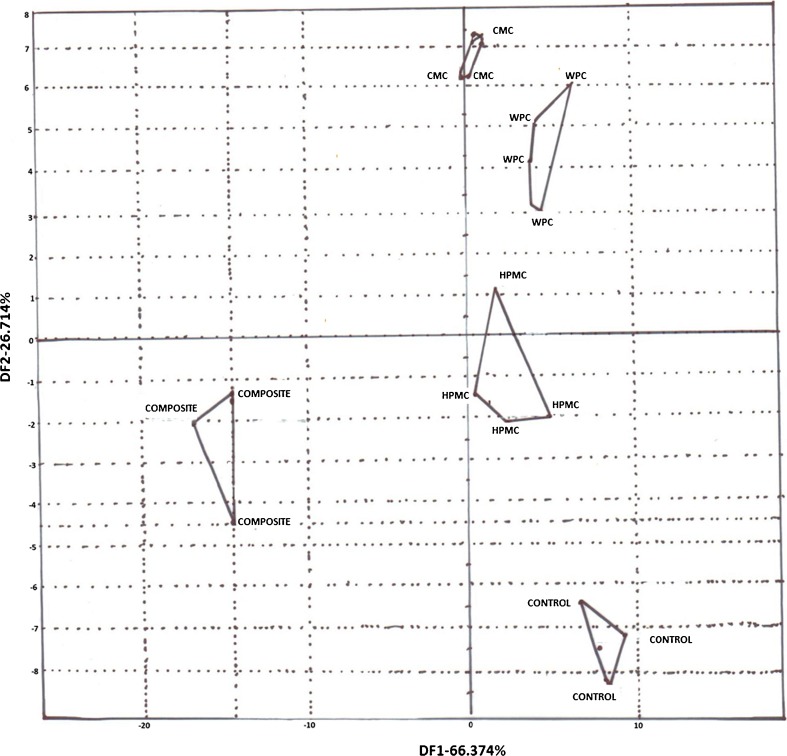
Principal Component Analysis (PCA) plots were obtained through E-Nose to analyze the headspace coffee volatiles present in coated roasted coffee samples and comparing it with the plot obtained for uncoated roasted coffee sample. Thus, this study gave a relative comparison of headspace volatiles with the control sample. Figure 5 clearly demonstrates the difference between the plots of the coated samples and uncoated samples and also predict that there had been some changes in the sensory attributes of roasted coffee beans due to coating material. The sensory attributes of CMC coated coffee beans showed the maximum distantly related properties while HPMC showed the minimum changes in properties. The overall comparison with control showed that some changes might have been induced in the component profile of headspace volatiles of the coated coffee beans which made it to be categorized as a different aromatic compound otherwise there would have been an overlapping of the sample’s PCA plot with the control.
Fig. 5.
Showing PCA plots of trial where samples were Control, composite, CMC, HPMC and WPC
Identification of compounds by GC-MS
The main flavored compounds identified in this study were 2,3-pentanedione, pyridine, dihydro-2-methyl-3 (2H)-furanone, methylpyrazine, furfural, 2-furanmethanol, 1 (acetyloxy)-2-propanone, 1-(2-furanyl) ethanone, 5-methyl-2-furancarboxaldehyde, 2 furanmethanol acetate, 2-methoxy-phenol, 1-(2-furanylmethyl)-1H-pyrrole, 4-Ethenyl-2-methoxy-phenol. The compounds identified by other researchers include 2-furfurylthiol and furfuryl methyldisulfide which has a sweet mocha aroma (Marsili 2010). These are the main character impact compounds for aroma of roasted Arabica coffee. The compounds found to be shared by most of the bean varieties include furanmethanol, 2,5-dimethylpyrazine, pyridine, 2,3-pentadione, furanmethanol acetate, 2-methylfuran and 2,3-pentadione (Bendlin and Chapman 2006). Furanmethanol has a characteristic caramel or burnt sugar like aroma. 2,3 Pentanedione gives a buttery flavor to coffee (Czerny et al. 1999) while 2,5 dimethylpyrimidine gives it a nutty roasted flavor. 2-Methyl dihydrofuran-3(2H)-one is a pleasant smelling furan derivative. Methylpyrazine is used as an index for monitoring the coffee roasting and is usually present in 7–30 % depending on the roasting conditions. It has a strong nutty, musty, meaty roasty flavor. Furfural and 3-furanmethanol are the key odorants responsible for coffee aroma in brewed coffee. Furfural gives a cooked pea, smoky aroma, while 3-furanmethanol gives it a burnt, unpleasant smell. 1-(2- Furanyl) ethanone is also one of the key component of coffee aroma. 2-Methoxy-4-ethyl-phenol has been associated with roasted or burnt flavor (Maga 1978). (Farah and Donangelo 2006) suggested that products from oxidation of phenolics compounds or from other chemical reactions involving phenolics compounds could be associated with low quality and perhaps with a specific off flavor named Rio. Pyridine is characterized by a pungent, penetrating, and diffusive odour, generally described as nauseating, but in extreme dilution it becomes warm, burnt, and smoky (Flament 2002). Pyridines are formed by degradation of sulphur containing amino acids.
Comparative analysis of volatile (Aroma) compounds by GC
The coated and uncoated coffee samples were stored at room temperature and volatiles were concentrated using SDE for GC injections after 1 week, 1 month and 2 months of coating. These samples were then analysed from the same batch, after this particular span of coating, so as to observe the shelf life up to which the edible coating is arresting the escape of volatile coffee compounds. It was found that there was an increase in volatile area peaks for almost all the samples for up to two months. The retention of coffee volatiles was highest after one week and one month of roasting while a gradual decrease of some of the volatile compounds was observed after one month of roasting. This indicates that the coating materials were efficient in retaining the volatile compounds for upto two months while in uncoated coffee sample, that was used as a control from the same batch, there was a loss of volatiles even after one week of roasting.
For CMC coated beans (Table 3), there was a gradual increase for almost all the volatiles such as, dihydro-2-methyl-3(2H)-furanone, which showed a tremendous increase in area after every analysis when compared with the uncoated coffee beans and aroma losses were comparatively less. Methylpyrazine showed an increase of 1-2 % in area everytime when compared with the control. Furfural showed an area % of 4.21 after 1 month of coating, while that of the control sample was 2.69 %. 2-furanmethanol showed a constant increase in area while the volatile losses were observed in control samples everytime. 1-(Acetyloxy)-2-propanone, 5-methyl-2-furancarboxaldehyde, 2-chloro-6-(2-furanylmethoxy)-4-(trichloromethyl)-pyridine and 4-ethenyl-2-methoxy-phenol also showed a gradual increase in areas over a period of 2 months. 1-(2-Furanyl) ethanone showed an increase in area from 4.52 to 13.62 %.
Table 3.
Showing Relative area% of identified volatile compounds of CMC coating with control (uncoated roasted coffee beans
| CMC Coating | |||||||
|---|---|---|---|---|---|---|---|
| RT-GC | Compound identified | Period after coating (Area %) (1 week) | Period after coating (Area %) (1 month) | Period after coating (Area %) (2 months) | |||
| Control | CMC | Control | CMC | Control | CMC | ||
| 2.23 | 2-3, Pentanedione | >1 | >1 | 2.62 | 2.09 | >1 | 2.07 |
| 4.39 | PYRIDINE | 19.47 | 23.38 | 18.84 | 19.42 | 24.04 | 20.04 |
| 6.56 | 3 (2H)-Furanone, dihydro-2-methyl- | 3.76 | 4.67 | 3.19 | 4.23 | 3.67 | 4.33 |
| 7.3 | Methylpyrazine | 9.18 | 9.26 | 7.64 | 8.89 | 8.72 | 8.90 |
| 7.8 | Furfural | 3.37 | 4.52 | 2.69 | 4.21 | 3.16 | 3.77 |
| 9.69 | 2- furanmethanol | 35.39 | 30.11 | 21.34 | 25.58 | 19.17 | 25.63 |
| 10.5 | 2- Propanone, 1-(acetyloxy)- | 1.61 | 1.34 | 1.12 | 1.60 | >1 | 1.54 |
| 13.60 | Ethanone, 1-(2-furanyl) | 4.12 | 4.52 | 8.39 | 8.34 | 7.86 | 13.62 |
| 19.47 | 2- Furancarboxaldehyde, 5-methyl | 4.82 | 5.87 | 3.37 | 5.15 | 3.77 | 4.93 |
| 24.91 | 2- Furanmethanol, acetate | 3.67 | 3.79 | 2.28 | >1 | 2.20 | 2.30 |
| 39.88 | Phenol, 2-methoxy- | 1.41 | >1 | 1.75 | 2.42 | 2.0 | 1.92 |
| 51.98 | 1H- Pyrrole, 1-(2-furanylmethyl)- | 1.68 | 1.46 | 1.90 | 2.26 | >1 | >1 |
| 57.91 | Phenol, 4-Ethenyl-2-Methoxy- | 3.72 | 3.56 | 1.17 | 1.34 | 2.13 | 2.86 |
| 61.02 | Pyridine, 2-chloro-6-(2-furanylmethoxy)-4-(trichloromethyl)- | 1.05 | 1.03 | 2.01 | 3.24 | >1 | >1 |
For HPMC coated beans (Table 4), 2,3-pentanedione was showing a tremendous increase in area as compared to the control samples which was showing an area of less than 1 %. Dihydro-2-methyl-3(2H)-furanone showed a gradual increase in volatile areas while some losses were observed in the control samples. Methylpyrazine showed the maximum retention as the initial area observed was 9.40 % while for the last trial also the area calculated was 9.28 %. 2-Furanmethanol showed some initial losses but then the volatiles were found to be retained in the next trials. 1-(2-Furanyl)-ethanone, 4-ethenyl-2-methoxy-phenol, 2-furanmethanol acetate and 5-methyl-2-furancarboxaldehyde also showed an increase in volatile area % when compared with the control areas.
Table 4.
Showing Relative area% of identified volatile compounds of HPMC coating with control (uncoated roasted coffee beans)
| HPMC Coating | |||||||
|---|---|---|---|---|---|---|---|
| RT-GC | Compound identified | Period after coating (Area %) (1 week) | Period after coating (Area %) (1 month) | Period after coating (Area %) (2 months) | |||
| Control | HPMC | Control | HPMC | Control | HPMC | ||
| 2.23 | 2-3, Pentanedione | >1 | >1 | 2.62 | 3.10 | >1 | 2.90 |
| 4.39 | PYRIDINE | 19.47 | 18.42 | 18.84 | 20.76 | 24.04 | 20.95 |
| 6.56 | 3 (2H)-Furanone, dihydro-2-methyl- | 3.76 | 5.59 | 3.19 | 4.08 | 3.67 | 4.63 |
| 7.3 | Methylpyrazine | 9.18 | 9.40 | 7.64 | 8.30 | 8.72 | 9.28 |
| 7.8 | Furfural | 3.37 | 6.26 | 2.69 | 3.92 | 3.16 | 3.85 |
| 9.69 | 2- furanmethanol | 35.39 | 30.58 | 21.34 | 25.27 | 19.17 | 25.98 |
| 10.5 | 2- Propanone, 1-(acetyloxy)- | 1.61 | 1.25 | 1.12 | 1.39 | >1 | 1.61 |
| 13.60 | Ethanone, 1-(2-furanyl) | 4.12 | 4.88 | 8.39 | 7.00 | 7.86 | 8.21 |
| 19.47 | 2- Furancarboxaldehyde, 5-methyl | 4.82 | 8.06 | 3.37 | 4.47 | 3.77 | 5.27 |
| 24.91 | 2- Furanmethanol, acetate | 3.67 | 1.34 | 2.28 | >1 | 2.20 | 2.54 |
| 39.88 | Phenol, 2-methoxy- | 1.41 | >1 | 1.75 | 2.01 | 2.0 | 1.92 |
| 51.98 | 1H- Pyrrole, 1-(2-furanylmethyl)- | 1.68 | 1.52 | 1.90 | 1.88 | >1 | >1 |
| 57.91 | Phenol, 4-Ethenyl-2-Methoxy- | 3.72 | 3.83 | 1.17 | 1.03 | 2.13 | 2.88 |
| 61.02 | Pyridine, 2-chloro-6-(2-furanylmethoxy)-4-(trichloromethyl)- | 1.05 | 1.29 | 2.01 | 2.69 | >1 | >1 |
Similar results are indicated in Table 5 for the coffee beans coated with whey protein concentrate, which showed that Pyridine was showing an initial increase in area % upto 1 month but after that, there was a gradual decrease in peak area. A constant increase in peak areas, when compared with the control samples, had also been observed in dihydro-2-methyl-3(2H)-furanone, methylpyrazine, furfural, 1-(2-furanyl) ethanone, 5-methyl-2- furancarboxaldehyde and 2-furanmethanol acetate. 2-Furanmethanol showed an initial decrease in peak area when compared with the control but for the next two trials, it showed an increase in area. The peak area % was 19.17 % for control and 25.16 % for the coated sample.
Table 5.
Showing Relative area% of identified volatile compounds of WPC coating with control (uncoated roasted coffee beans)
| WPC Coating | |||||||
|---|---|---|---|---|---|---|---|
| RT-GC | Compound identified | Period after coating (Area %) (1 week) | Period after coating (Area %) (1 month) | Period after coating (Area %) (2 months) | |||
| Control | WPC | Control | WPC | Control | WPC | ||
| 2.23 | 2-3, Pentanedione | >1 | 1.16 | 2.62 | 3.45 | >1 | 2.49 |
| 4.39 | Pyridine | 19.47 | 23.87 | 18.84 | 20.78 | 24.04 | 20.89 |
| 6.56 | 3 (2H)-Furanone, dihydro-2-methyl- | 3.76 | 4.69 | 3.19 | 4.09 | 3.67 | 4.41 |
| 7.3 | Methylpyrazine | 9.18 | 9.78 | 7.64 | 8.07 | 8.72 | 9.14 |
| 7.8 | Furfural | 3.37 | 3.99 | 2.69 | 2.92 | 3.16 | 3.24 |
| 9.69 | 2- Furanmethanol | 35.39 | 24.62 | 21.34 | 23.61 | 19.17 | 25.16 |
| 10.5 | 2- Propanone, 1-(acetyloxy)- | 1.61 | 0.97 | 1.12 | 1.56 | >1 | 1.49 |
| 13.60 | Ethanone, 1-(2-furanyl) | 4.12 | 9.45 | 8.39 | 7.35 | 7.86 | 10.89 |
| 19.47 | 2- Furancarboxaldehyde, 5-methyl | 4.82 | 5.14 | 3.37 | 4.10 | 3.77 | 4.59 |
| 24.91 | 2- Furanmethanol, acetate | 3.67 | 3.85 | 2.28 | 1.33 | 2.20 | 2.33 |
| 39.88 | Phenol, 2-methoxy- | 1.41 | >1 | 1.75 | 1.97 | 2.0 | 1.79 |
| 51.98 | 1H- Pyrrole, 1-(2-furanylmethyl)- | 1.68 | 1.53 | 1.90 | 1.99 | >1 | >1 |
| 57.91 | Phenol, 4-Ethenyl-2-Methoxy- | 3.72 | 3.04 | 1.17 | 1.16 | 2.13 | 2.34 |
| 61.02 | Pyridine, 2-chloro-6-(2-furanylmethoxy)-4-(trichloromethyl)- | 1.05 | 0.90 | 2.01 | 2.23 | >1 | >1 |
For composite coated coffee beans (Table 6), the results showed an initial increase of 2,3-pentanedione, pyridine, methylpyrazine, and furfural while continuous increase was observed for dihydro-2-methyl-3(2H)-furanone, 1-(acetyloxy)-2- propanone, 1-(2-furanyl) ethanone, 5-methyl-2-furancarboxaldehyde, 2-furanmethanol acetate, 2-methoxyphenol, and 4-ethenyl-2-methoxyphenol for a period of two months after coating of beans.
Table 6.
Showing Relative area% of identified volatile compounds of Composite coating with control (uncoated roasted coffee beans)
| Composite coating | |||||||
|---|---|---|---|---|---|---|---|
| RT-GC | Compound identified | Period after coating (Area %) (1 week) | Period after coating (Area %) (1 month) | Period after coating (Area %) (2 months) | |||
| Control | Composite | Control | Composite | Control | S | ||
| 2.23 | 2-3, Pentanedione | >1 | 1.16 | 2.62 | 1.80 | >1 | >1 |
| 4.39 | Pyridine | 19.47 | 21.90 | 18.84 | 15.61 | 24.04 | 18.12 |
| 6.56 | 3 (2H)-Furanone, dihydro-2-methyl- | 3.76 | 4.62 | 3.19 | 3.59 | 3.67 | 4.14 |
| 7.3 | Methylpyrazine | 9.18 | 9.62 | 7.64 | 7.66 | 8.72 | 9.43 |
| 7.8 | Furfural | 3.37 | 3.91 | 2.69 | 2.68 | 3.16 | 3.09 |
| 9.69 | 2- furanmethanol | 35.39 | 32.69 | 21.34 | 24.72 | 19.17 | 31.69 |
| 10.5 | 2- Propanone, 1-(acetyloxy)- | 1.61 | 1.64 | 1.12 | 1.56 | >1 | >1 |
| 13.60 | Ethanone, 1-(2-furanyl) | 4.12 | 4.29 | 8.39 | 12.34 | 7.86 | 11.69 |
| 19.47 | 2-Furancarboxaldehyde, 5-methyl | 4.82 | 5.37 | 3.37 | 4.15 | 3.77 | 5.37 |
| 24.91 | 2- Furanmethanol, acetate | 3.67 | 4.03 | 2.28 | 3.53 | 2.20 | 2.12 |
| 39.88 | Phenol, 2 methoxy- | 1.41 | >1 | 1.75 | 2.29 | 2.0 | 2.51 |
| 51.98 | 1H- Pyrrole, 1-(2-furanylmethyl)- | 1.68 | 1.48 | 1.90 | 2.28 | >1 | >1 |
| 57.91 | Phenol, 4-Ethenyl-2-Methoxy- | 3.72 | 3.54 | 1.17 | 1.32 | 2.13 | 1.71 |
| 61.02 | Pyridine, 2-chloro-6-(2-furanylmethoxy)-4 (trichloromethyl) | 1.05 | 0.99 | 2.01 | 2.38 | >1 | >1 |
FTIR analysis for non-volatiles
FTIR analysis suggested that there had been no such significant change in the overall component profile of coffee non-volatiles, when coated samples were compared with the uncoated samples. Therefore, this result confirms that all the coating materials were causing a chemical and physical change only in the coffee volatiles and were not causing any significant changes in the coffee non-volatiles. Figure 6 shows the FTIR spectra obtained for uncoated sample of coffee beans while Figs. 7, 8, 9 and 10 shows the FT-IR spectra for CMC coated, HPMC coated, WPC coated and composite coated coffee samples respectively. Coffee non-volatiles are the major precursors of coffee volatiles, thus it shows that coating materials are not causing any hindrance in the stability of these precursors and thus is maintaining the functionality of these compounds.
Fig. 6.
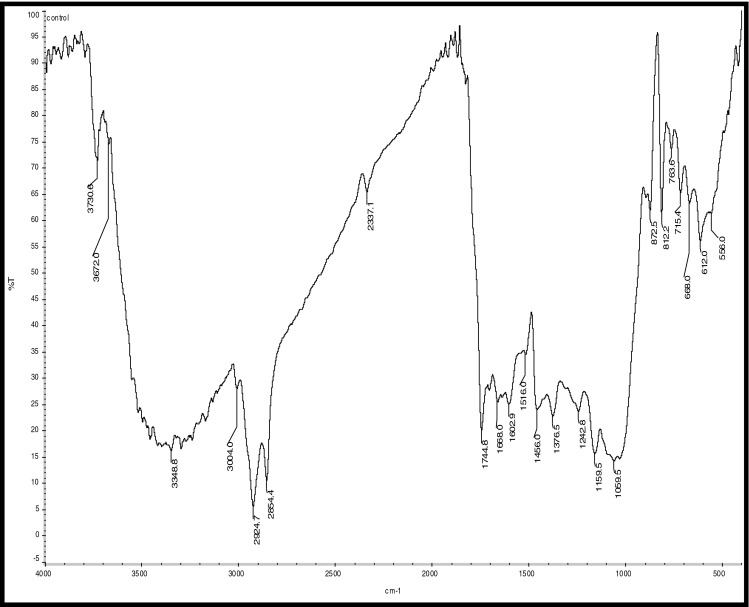
FTIR analysis of uncoated roasted coffee sample (control)
Fig. 7.
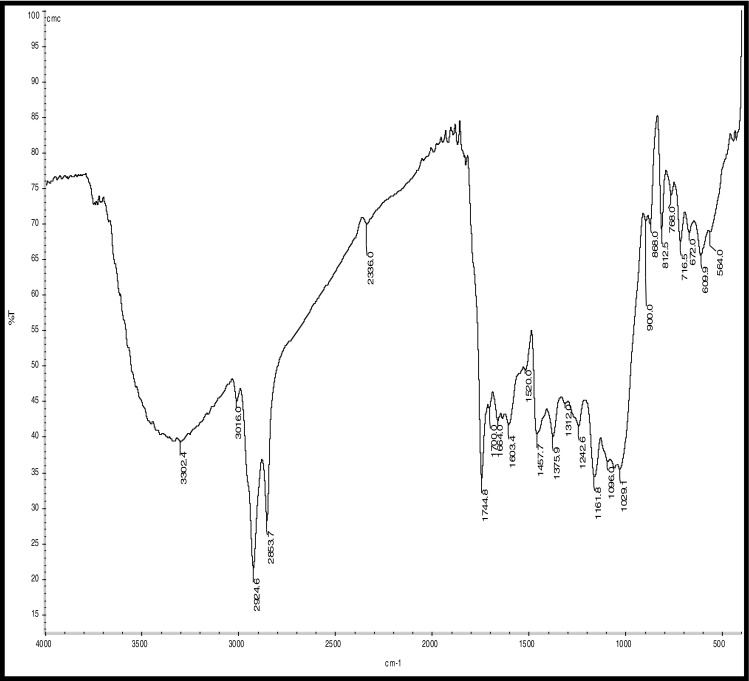
FTIR Analysis of CMC Coated coffee beans
Fig. 8.
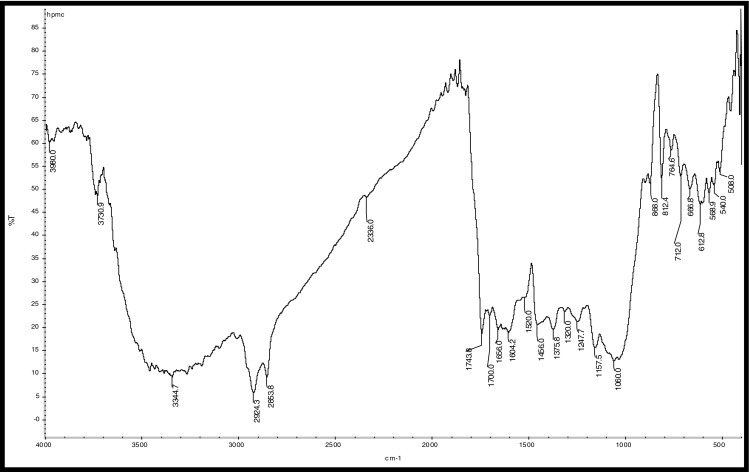
FTIR Analysis of HPMC Coated coffee beans
Fig. 9.
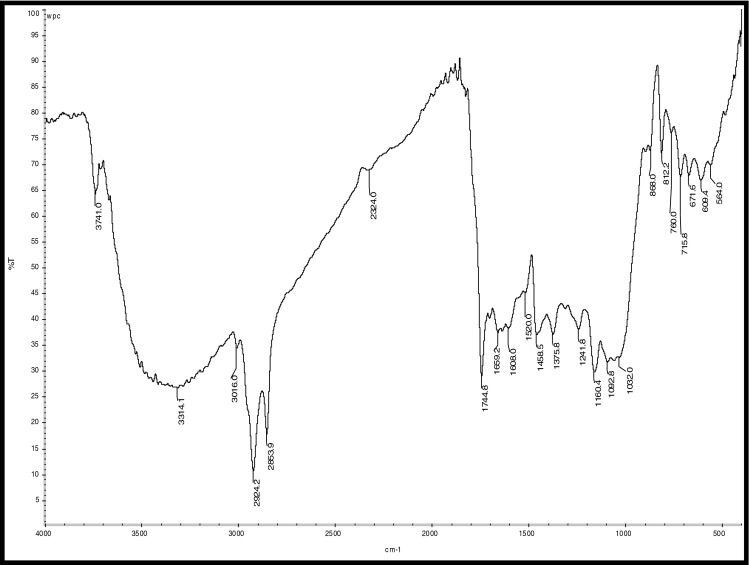
FTIR Analysis of WPC Coated coffee beans
Fig. 10.
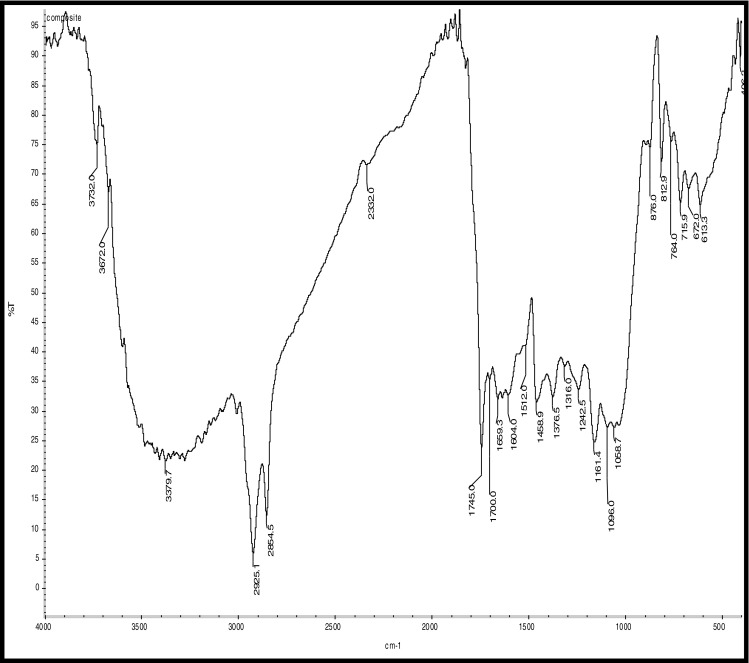
FTIR Analysis of Composite Coated coffee beans
Hydrocarbons show IR absorption peaks between 2,800 and 3,300 cm-1 due to C-H stretching vibrations. The hybridization of the carbon affects the exact position of the absorption; stiffer bonds vibrate at higher frequencies. sp3 C-H: 2,800—3,000 cm-1, sp2 C-H: 3,000—3,100 cm-1, and sp C-H: 3,300 cm-1 . Compounds corresponding to these regions include lipids (2,920–2,850 cm-1), unsaturated ester/lactone (1,780–1,762 cm-1), aliphatic esters (1,755–1,740 cm-1), aldehydes (1,739–1,724 cm-1), ketones (1,725–1,705 cm-1), aliphatic acids (1,714–1,705 cm-1), aromatic acids (1,700–1,680 cm-1), caffeine (1,650–1,600 cm-1), and chlorogenic acid (1,150–1,300 cm-1) (Socrates 1994; Briandet et al. 1996). The peaks at 2,924 and 2,855 cm-1can be assigned to asymmetrical stretching vibrations of C − H bonds, whereas the peak at 1,746 cm-1 arises from C = O bond stretching. Stretching and bending of C = O and -CH2- accounts for the maximum at 1,163 cm-1 (Hennessy et al. 2009). Benzene rings often give characteristic absorptions at about 680–900 cm-1. Ethers have a C-O stretch that appears in the fingerprint region at 1,050–1,260 cm-1. This is generally a strong absorption, but can be difficult to detect if the fingerprint region is complex. Carbonyl compounds can be found at 1,640–1,820 cm-1 and give generally a very strong peak. Aldehydes correspond to 1,720–1,740 cm-1, Ketones to 1,705–1,750 cm-1 and carboxylic acids to 1,700–1,725 cm-1. Ketones have the simplest spectra among the carbonyl compounds, with the C = O stretch and the C-H stretch being the major absorptions (Lyman et al. 2003)
Conclusion
In this study, an attempt was made to minimize the loss of volatiles from coffee beans by giving it a coating of carboxymethylcellulose, hydroxypropylmethyl cellulose and Whey protein concentrate which showed that cellulose derivatives (CMC and HPMC) gave the best aroma retentions when compared with the uncoated roasted samples. Whey protein concentrate has also showed a good retention of aromatic compounds but still some of the volatile compounds were found to be able to escape to the environment because of the crevices and peeling off of coating material from the surface of beans, as was observed in the images obtained by SEM analysis. Because of the viscosity differences and rheology of the coating materials, it may have become difficult for the whey protein coating to form strong bonds with the porous surface of coffee beans, while cellulose derivatives, which have more viscosity, managed to form a uniform layer over the bean surface. Moreover, Texture analysis also predicts the enhanced durability of the coffee beans due to the edible coating. In addition, FTIR analysis has showed that edible coatings do not affect the non-volatile profiles of the coffee beans, and thus only the volatile retentions are observed. Therefore these edible coatings have proved their significance in preserving the aromatic attributes of roasted coffee beans for over a shelf life of two months and thus, this coating concept promises a great potential for the storage application of roasted coffee beans.
Acknowledgments
Authors thank the Director of CSIR-CFTRI for giving kind permission to publish this paper.
References
- Belitz HD, Grosch W, Schieberle P. Coffee, Tea, Cocoa. Berlin: Vatican Springer; 2009. [Google Scholar]
- Bendlin E, Chapman JM (2006) Characterization of roasted coffee bean aroma profiles by SPME. Analytical Chemistry General Posters
- Briandet R, Kemsley EK, Wilson RH. Approaches to adulteration detection in instant coffees using infrared spectroscopy and chemometrics. J Sci Food Agric. 1996;71(3):359–366. doi: 10.1002/(SICI)1097-0010(199607)71:3<359::AID-JSFA593>3.0.CO;2-D. [DOI] [Google Scholar]
- Buffo RA, Cardelli-Freire C. Coffee flavor: an overview. Flavour Fragr J. 2004;19(2):99–104. doi: 10.1002/ffj.1325. [DOI] [Google Scholar]
- Czerny M, Mayer F, Grosch W. Sensory study on the character impact odorants of roasted Arabica coffee. J Agric Food Chem. 1999;47:695–699. doi: 10.1021/jf980759i. [DOI] [PubMed] [Google Scholar]
- Denis Fisk I, Kettle A, Hofmeister S, Virdie A, Kenny JS. Discrimination of roast and ground coffee aroma. Flavour. 2012;1:1–8. doi: 10.1186/2044-7248-1-1. [DOI] [Google Scholar]
- Ekneet S, Bodhisattwa C. Experiments and numerical modeling to estimate the coating variability in a pan coater. Int J Pharm. 2011;418(2):286–296. doi: 10.1016/j.ijpharm.2011.05.041. [DOI] [PubMed] [Google Scholar]
- Fabra MJ, Hambleton A, Talens P, Debeaufort F, Chiralt A, Voilley A. Aroma barrier properties of sodium caseinate based edible films. Biomolecules. 2008;9:1406–1410. doi: 10.1021/bm701363p. [DOI] [PubMed] [Google Scholar]
- Farah A, Donangelo CM. Phenolic compounds in coffee. Braz J Plant Physiol. 2006;18:23–36. doi: 10.1590/S1677-04202006000100003. [DOI] [Google Scholar]
- Fitter R, Kaplinksy R. Who gains from product rents as the coffee market becomes more differentiated? A value-chain analysis. IDS Bull. 2001;32(3):69–82. doi: 10.1111/j.1759-5436.2001.mp32003008.x. [DOI] [Google Scholar]
- Flament I. Coffee flavor chemistry. London: British Library Cataloguing; 2002. [Google Scholar]
- Gardner J, Bartlett P. Electronic Noses. Oxford: Oxford Univ. Press; 1999. [Google Scholar]
- Grosch W. Coffee: Recent developments. In: Clarke RJ, Vitzthum OZ, editors. In Chemistry III: Volatile Compounds. Oxford: Blackwell Science; 2001. pp. 68–89. [Google Scholar]
- Hennessy S, Downey G, Odonnell CP. Confirmation of food origin claims by Fourier transform infrared spectroscopy and chemometrics: extra virgin olive oil from Liguria. J Agric Food Chem. 2009;57(5):1735–1741. doi: 10.1021/jf803714g. [DOI] [PubMed] [Google Scholar]
- Hindmarch I, Rigney U, Stanley N, Quinlan P, Rycroft J, Lane J. A naturalistic investigation of the effects of day-long consumption of tea, coffee and water on alertness, sleep onset and sleep quality. Psychopharmacology. 2000;149:203–216. doi: 10.1007/s002130000383. [DOI] [PubMed] [Google Scholar]
- Illy A, Viani R. Espresso Coffee: The Chemistry of Quality. London: Academic; 1995. [Google Scholar]
- International Coffee Organization (ICO) 2014 http://www.ico.org/
- Jokanovića MR, Džinića NR, Cvetkovićb BR, Grujićc S, Odžakovićc B. Changes of physical properties of coffee beans during roasting. APTEFF. 2012;43:21–31. doi: 10.2298/APT1243021J. [DOI] [Google Scholar]
- Lyman DJ, Benck R, Dell S, Merle S, Murray Wijelath J. FTIR-ATR analysis of brewed coffee: effect of roasting conditions. J Agric Food Chem. 2003;51(11):3268–3272. doi: 10.1021/jf0209793. [DOI] [PubMed] [Google Scholar]
- Maga JA. Simple phenol and phenolics compounds in food flavour. Food Technol. 1978;10:323–372. doi: 10.1080/10408397809527255. [DOI] [PubMed] [Google Scholar]
- Makri E, Tsimogiannis D, Dermesonluoglu EK, Taokis PS. Modelling of Greek coffee aroma loss during storage at different temperatures and water activities. Procedia Food Sci. 2011;1:1111–1117. doi: 10.1016/j.profoo.2011.09.166. [DOI] [Google Scholar]
- Marsili R. Flavor fragnance and odour analysis. 2. Boca Raton: CRC Press, Taylor and Francis group; 2010. [Google Scholar]
- Nagaraju VD, Murthy CT, Ramalakshmi K, Srinivasa Rao PN. Studies on roasting of coffee beans in a spouted bed. J Food Eng. 1997;31:263–270. doi: 10.1016/S0260-8774(96)00026-X. [DOI] [Google Scholar]
- Nagaraju VD, Ramalakshmi K. Roasting of coffee beans in a spouted bed roaster. J Food Sci Technol. 2002;39:530–533. doi: 10.1007/s13197-010-0088-z. [DOI] [PMC free article] [PubMed] [Google Scholar]
- Nagaraju VD, Bhattacharya S. Roasting green coffee beans using spouted bed roaster: changes in physical characteristics. J Food Sci Technol. 2010;47(6):674–677. doi: 10.1007/s13197-010-0088-z. [DOI] [PMC free article] [PubMed] [Google Scholar]
- NIST/EPA/NIH . Mass spectral library: Standard reference database A. Gaithersburg: National Institute of Standards and Technology; 1995. [Google Scholar]
- Pranoto Y, Marseno DW, Haryadi X. Methylcellulose and hydroxyprophyl methylcellulose-based coatings on partially defatted peanut to reduce frying oil uptake and enhance oxidative stability. As J Food Ag-Ind. 2009;2(04):891–900. [Google Scholar]
- Schenker S, Handschin S, Frey B, Perren R, Escher F. Pore structure of coffee beans affected by roasting conditions. J Food Sci. 2000;65(3):452–457. doi: 10.1111/j.1365-2621.2000.tb16026.x. [DOI] [Google Scholar]
- Sobésa Café (2008) Available at: http://www.sobesa.com.br
- Socrates G. Infrared Characteristic Group Frequencies. New York: John Wiley; 1994. [Google Scholar]
- Yeretzian C, Jordan A, Lindinger W. Analysing the headspace of coffee by proton-transfer-reaction mass-spectrometry. Int J Mass Spectrom. 2003;223–224:115–139. doi: 10.1016/S1387-3806(02)00785-6. [DOI] [Google Scholar]


