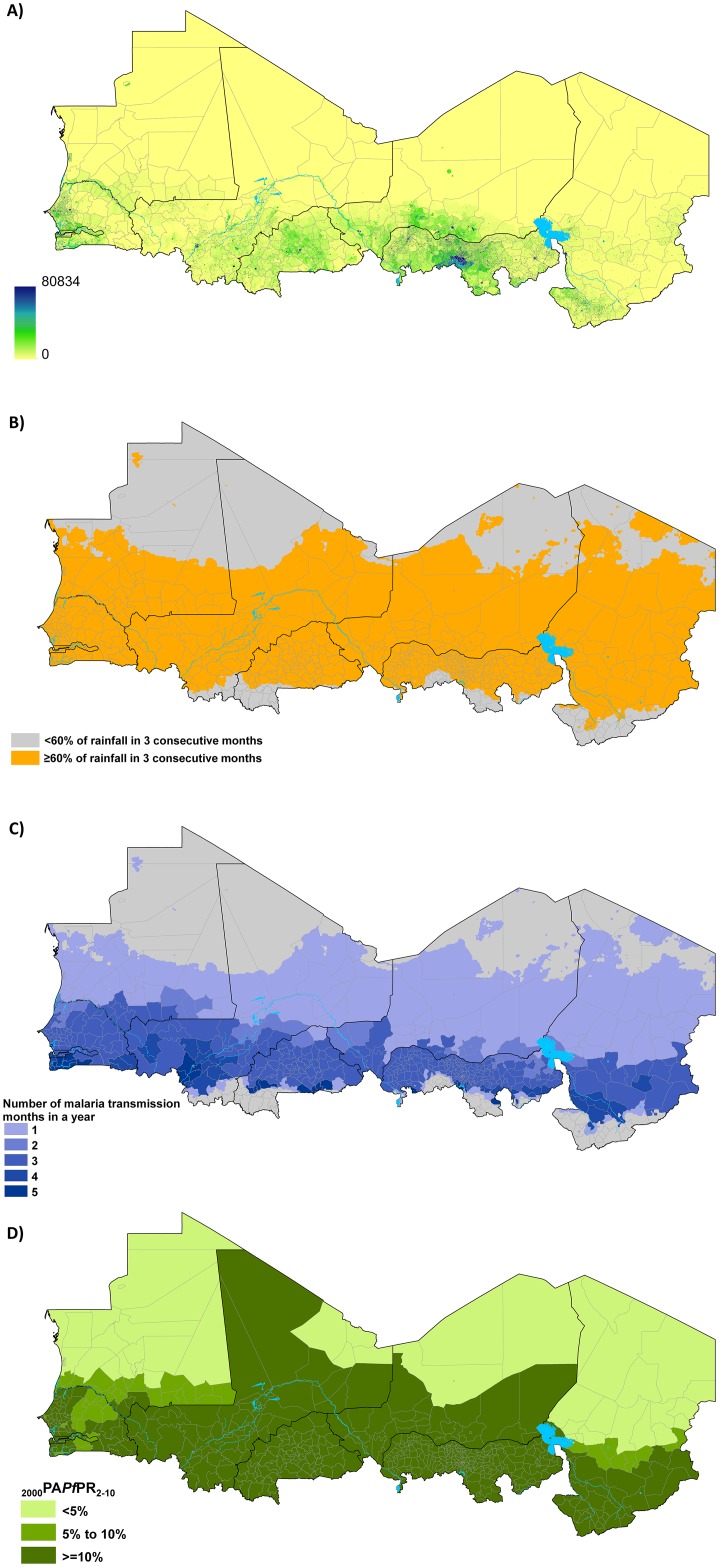
Fig 2. Map of Sahelian health districts (n = 597) showing A) the distribution of population in 2015 at 1 x 1 km spatial resolution [source: www.worldpop.org]; B) areas (orange) where 60% or more of the annual total rainfall occurs in any three consecutive months; C) the median number of malaria transmission months in an average year in seasonal health districts [source: Grover-Kopec et al 2006; D) population adjusted estimates of P. falciparum parasite rate standardized to the ages 2 to 10 years (PAPfPR2-10) for the year 2000 [source: Noor et al 2014].
In Nigeria, health districts from the states of Bauchi, Borno, Jigawa, Kano, Katsina, Kebi, Sokoto, Yobe and Zamfara were included in the analysis.

