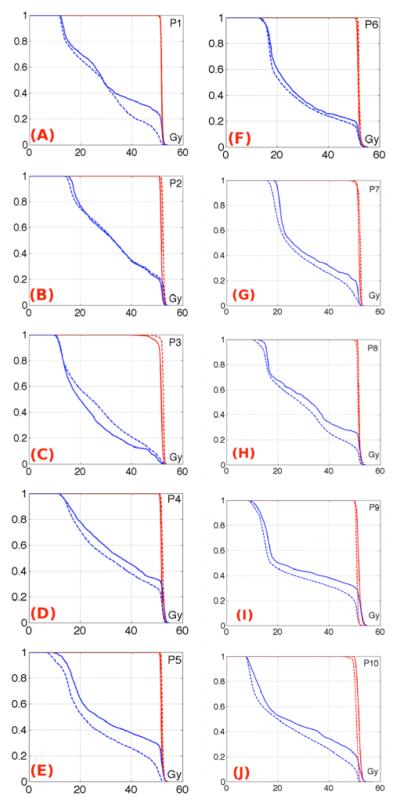
Figure 4.
The first column shows the normalized total delivered dose DVH (dashed line) compared to the planned dose DVH (solid line) for patients treated with balloon A (P1 stands for patient 1). The second column shows the normalized total delivered dose DVH (dashed line) compared to the planned dose DVH (solid line) for patients treated with balloon B. The prostate DVHs are in red and the rectal wall DVHs are in blue.

