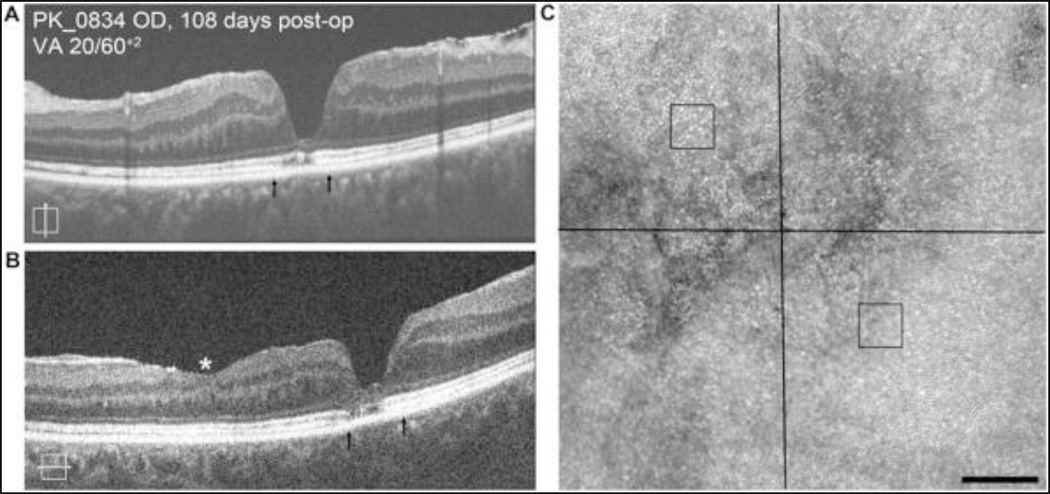
Figure 1.
Imaging of subject PK_0834 at 108 days following MH closure. Vertical SD-OCT B-scan (A) reveals patchy disruption of EZ band along with advanced loss of the ONL at the base of the fovea. Similar changes are seen in horizontal B-scan (B). Arrows depict area imaged with AOSLO. Asterisk (*) denotes region of iatrogenic surgical thinning of inner retinal layer. AOSLO imaging reveals disruption of photoreceptor mosaic corresponding to regions of SD-OCT abnormalities (C). Cone density was measured at two ROIs adjacent to this disruption, each being 0.6 degrees from the foveal center (black squares). The infero-nasal ROI had a density of 59,504 cones/mm2 which is within 2 standard deviations of the normal mean at this eccentricity [8]. In contrast, the supero-temporal ROI had a density of 44,959 cones/mm2, which is greater than 2 standard deviations below the normal mean at this eccentricity [8]. Scale bars = 100 µm.

