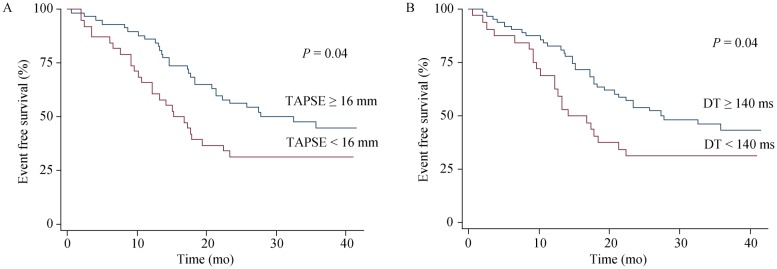
Figure 1. Kaplan-Meier event-free survival estimates.

Kaplan-Meier plots showed the time of the combined end point of death and cardiac hospitalization for patients with (A) TAPSE < 16 mm vs. ≥ 16 mm and (B) DT < 140 ms vs. ≥ 140 ms. DT: deceleration time; TAPSE: tricuspid annular plane systolic excursion.
