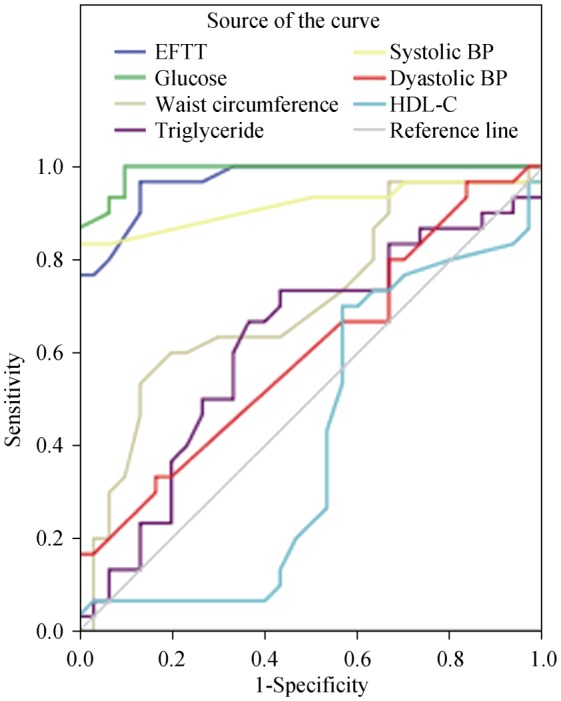
Figure 1. ROC chart analysis of epicardial fat tissue thickness and the components of metabolic syndrome.

BP: Blood pressure; EFTT: epicardial fat tissue thickness; HDL: high density lipoprotein; ROC: receivers operating characteristic.

BP: Blood pressure; EFTT: epicardial fat tissue thickness; HDL: high density lipoprotein; ROC: receivers operating characteristic.