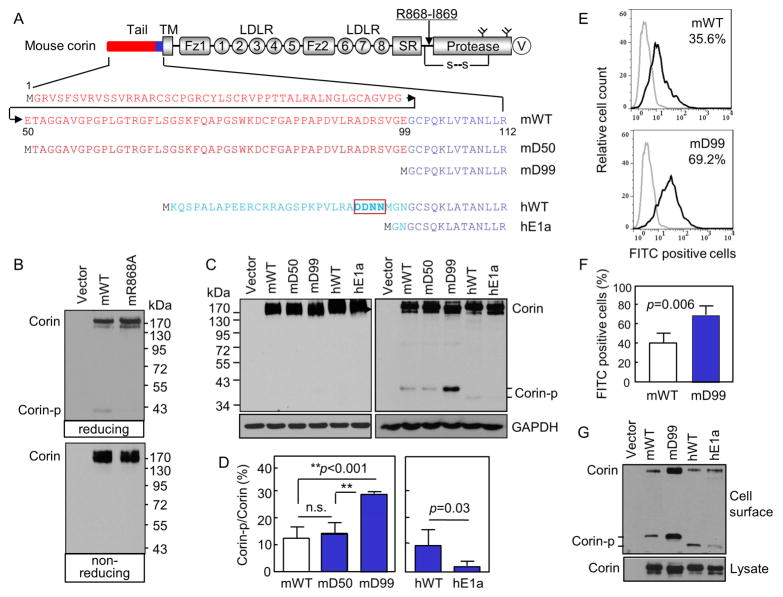
Fig. 1. Corin cytoplasmic tail and activation.
(A) Corin domains and cytoplasmic sequences. An arrow indicates the activation site. A disulfide bond (s-s) links the protease domain and the propeptide. Y-shaped symbols in the protease domain indicate N-glycosylation sites. A V5 tag (V) is at the C-terminus. Cytoplasmic sequences in mouse (m) corin WT and the truncation mutants mD50 and mD99 as well as human (h) corin WT and the hE1a variant are shown. (B, C) Western analysis of corin proteins under reducing (B, top; C, right) and non-reducing (B, bottom; C, left) conditions. (D) Percentages of corin activation (Corin-p vs. Corin bands) were calculated based on densitometry of Western blots represented in C, right panel. n=4 per group. **p<0.001; n.s., not significant. (E, F) Flow cytometric analysis of surface corin in HEK293 cells transfected with WT and mD99 plasmids. Data are mean ± S.D. of corin-positive cells. n=4 per group. (G) Western analysis of cell surface-labeled corin proteins under reducing conditions (top). Corin proteins in cell lysates were controls (bottom).

