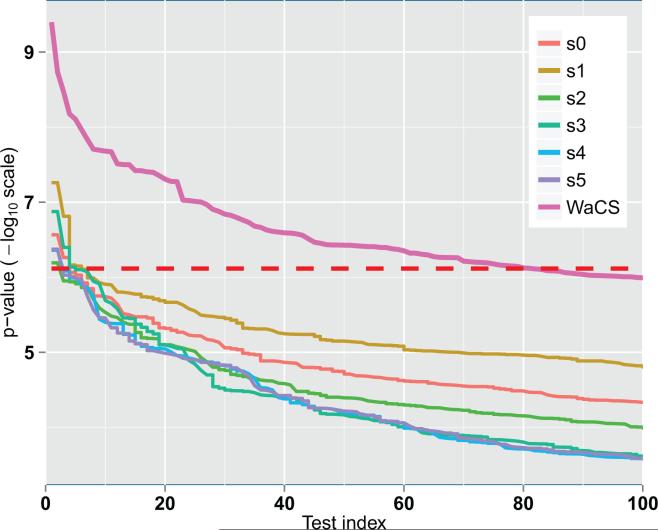
Figure A.12.
Comparison of sorted p-values (in – log10 scale) from individual scales of WaCS and combination of multiple scales of WaCS (bold pink). Red dashed line denotes to the Bonferroni threshold at 0.01. It shows that our individual scales We can observe that combining the multi-resolution approach allows for detection of more connections affected by disease and risk compared to the baseline approach.

