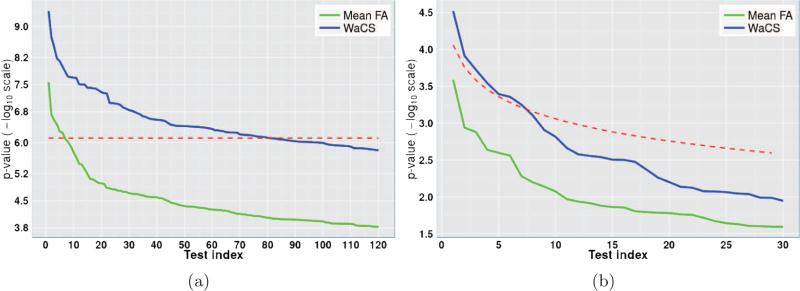
Figure 6.
Comparison of sorted p-values using FA (green) and WaCS (blue) and multiple comparisons correction thresholds (red) in – log10 scale. a) p-values and Bonferroni threshold at α ≤ 0.01 from ADRC study (AD vs. CN), b) p-values and FDR threshold at 0.05 from WRAP study (FH+ vs FH−). The connections with – log10(p)-value above the threshold are considered as showing significant group differences. We can observe that the multi-resolution approach allows for detection of more connections affected by disease and risk compared to the baseline approach.

