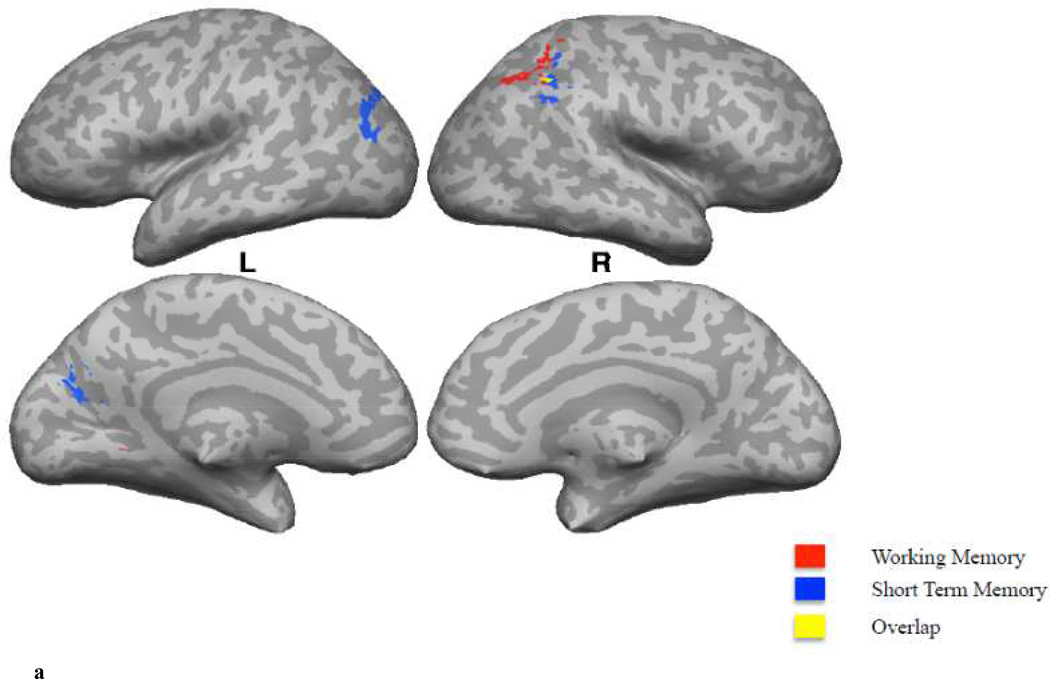
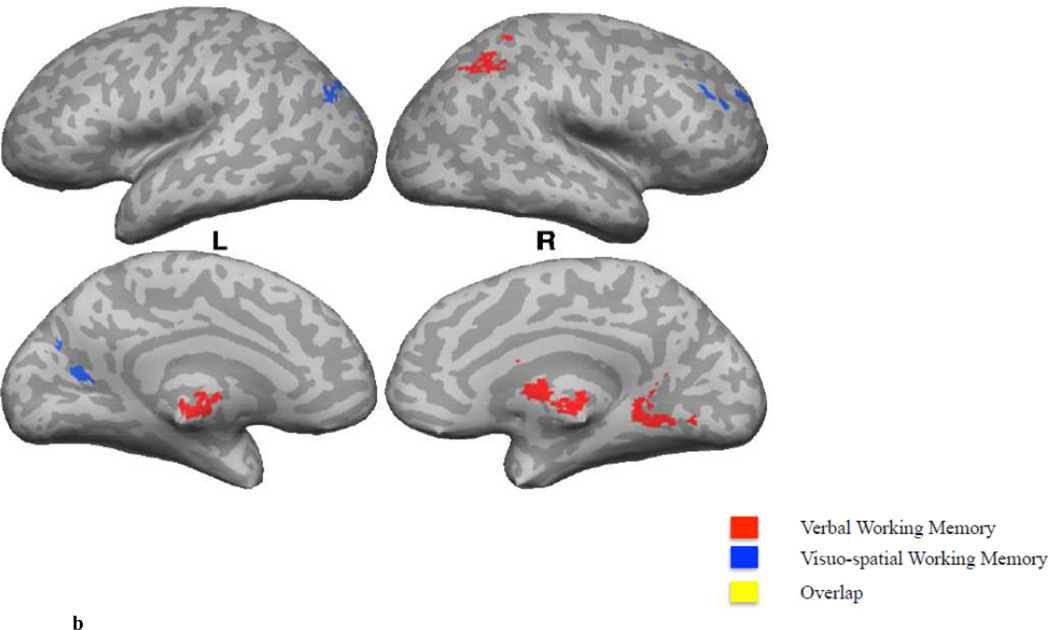
Figure 2.
A. A comparison of correlations of whole-brain fALFF values with WM (B+J, in red) versus STM (A+I, in blue) measures. Regions in yellow represent the spatial intersection of the statistically thresholded maps corresponding to the correlation of whole-brain fALFF values with WM and STM measures.
B. A comparison of correlations of whole-brain fALFF values with Verbal (A+B, in red) versus Visuospatial (I+J, in blue) measures. Regions in yellow represent the spatial intersection of the statistically thresholded maps corresponding to the correlation of whole-brain fALFF values with Verbal and Visuospatial measures.


