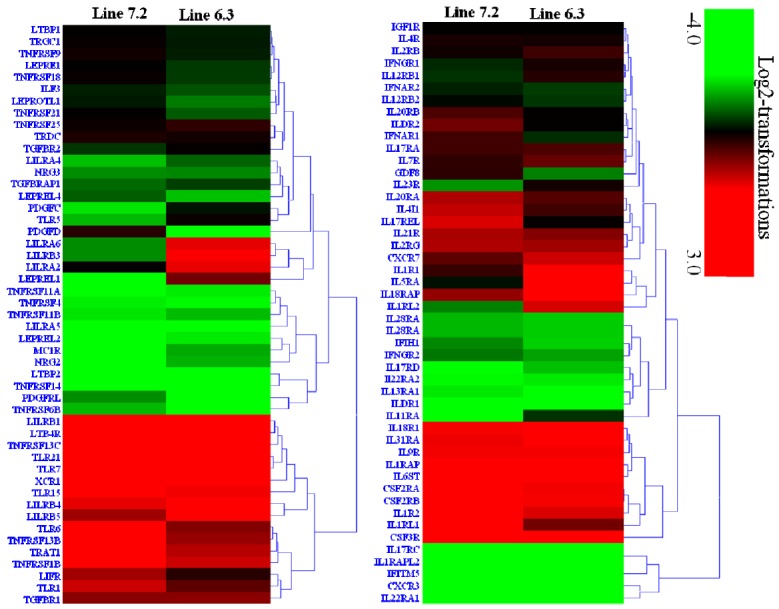
Figure 5.

Hierarchical cluster of 97 cytokines receptor genes in spleen of two chicken lines (line 6.3 and line 7.2) responsive to E. maxima/C. perfringens (EM/CP) co-infection, based on Euclidean distances correlation analyses. The genes included here showed significant differences in gene expression (p<0.01, fold change ≥2) with genes in red and green showing upregulated and downregulated, respectively.
