
Figure 3.
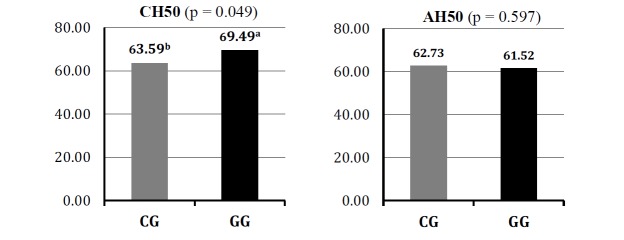
Plot of least square means of hemolytic complement activity in the classical (CH50) and alternative (AH50) pathway depending on genotypes of the porcine C9 gene.
Official websites use .gov
A
.gov website belongs to an official
government organization in the United States.
Secure .gov websites use HTTPS
A lock (
) or https:// means you've safely
connected to the .gov website. Share sensitive
information only on official, secure websites.
Plot of least square means of hemolytic complement activity in the classical (CH50) and alternative (AH50) pathway depending on genotypes of the porcine C9 gene.