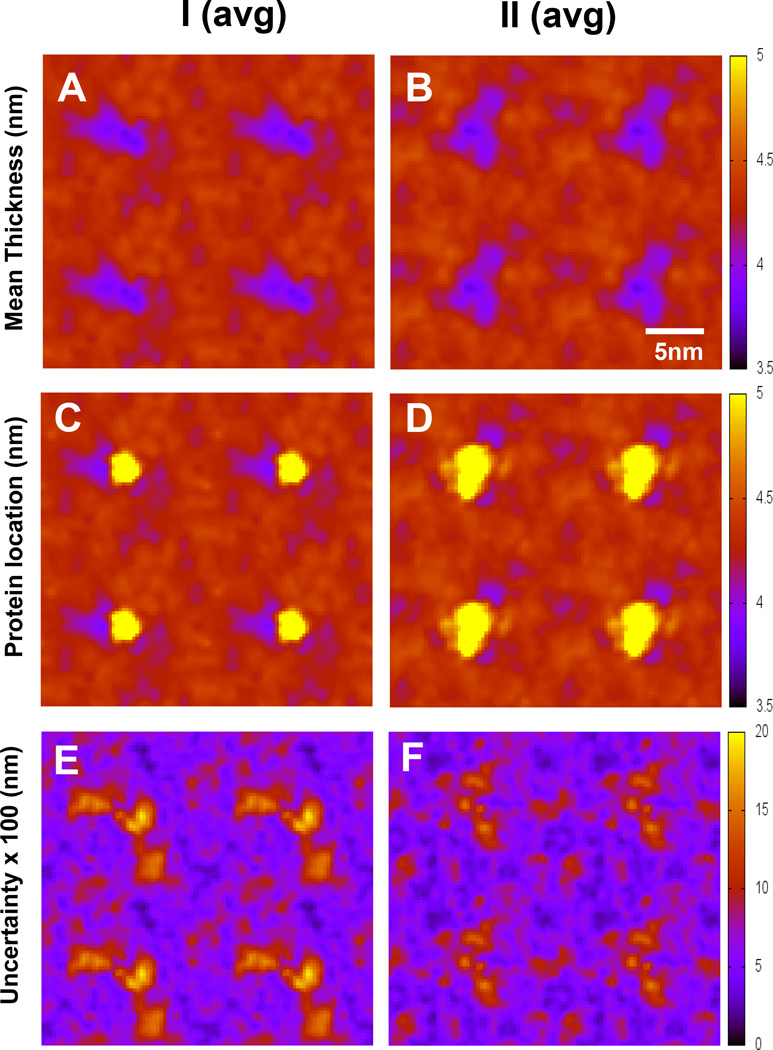
FIG. 10. Lipid bilayer thickness maps of UA Aβ42/lipid/water/ion complexes.
Lipid bilayer thickness maps of I (avg) and II (avg) complexes without (A, B) and with overlays (C, D) of protein locations (yellow) are shown. The uncertainty maps (E, F) of thickness based on the standard errors of the means are also given. The calculations were over the last 50 ns of the simulations with means and standard errors obtained from 8 independent replicates.

