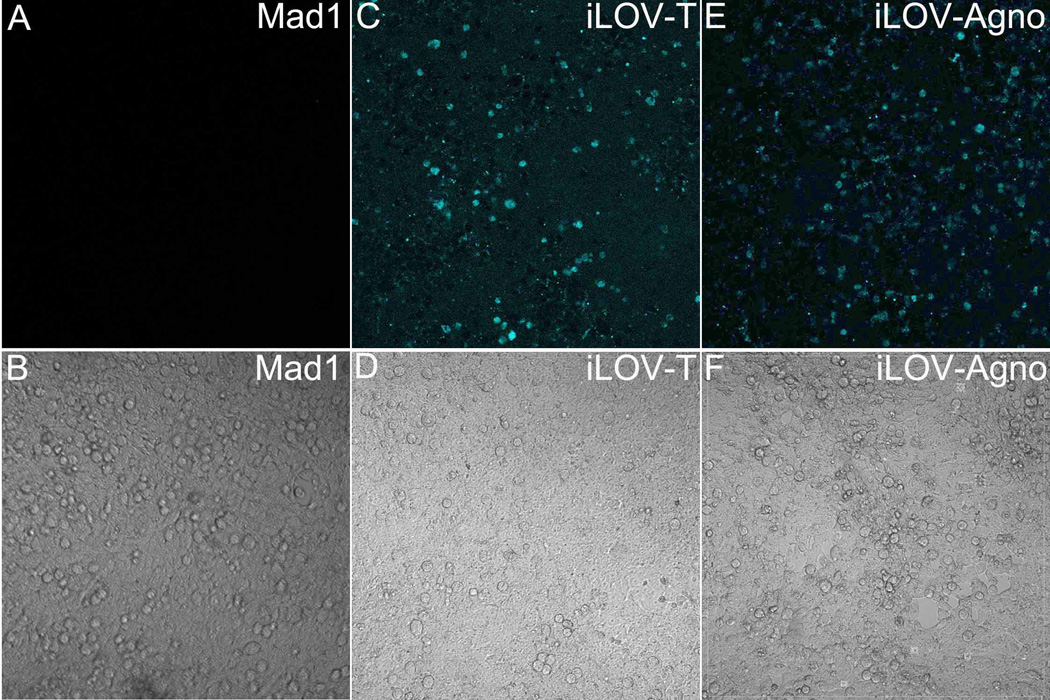
Fig. 3.
Detection of iLOV signal by confocal microscope 5 days post transfection of 293FT cells with JCV Mad1 (A,B), JCV iLOV-T (C,D) and JCV iLOV-Agno (D,E). The upper panels (panel A, C, E) show confocal images, where the fluorescent signal of iLOV is assigned to light blue color. The lower panels (B, D, F) are images captured by differential interference contrast (DIC) and show >90% confluence of 293FT cells.

