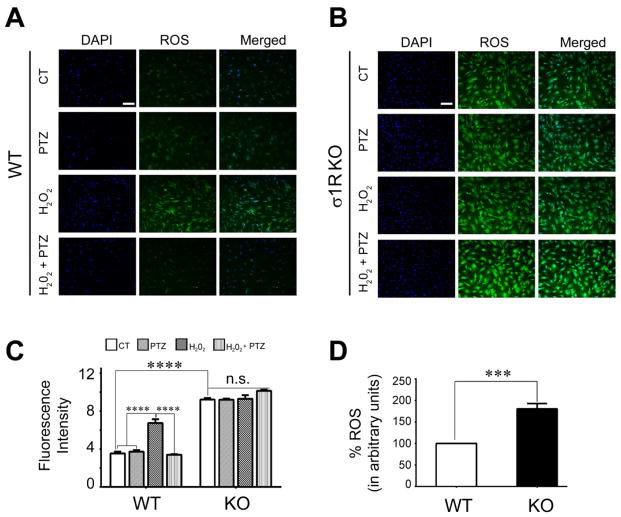
Fig. 2. Analysis of ROS levels in WT and σ1RKO mouse Müller cells.
Fluorescent detection of reactive oxygen species (ROS) using CellROX® Green Reagent. Müller cells from WT (wildtype, A) or σR1KO (knockout, B) mice were seeded on coverslips for 18 h. Cells either were or were not (control) exposed for 6 h to 200μM H202 in the presence or absence of (+)-PTZ, including cells treated with (+)-PTZ alone, they were incubated with CellROX® Green Reagent to detect ROS as described. Green fluorescent signals of ROS in WT and σ1RKO cells were visualized by epifluorescence; DAPI was used to label nuclei (blue). Scale bar, 100 μm. (C) Quantification of fluorescent intensity reflecting ROS levels of data shown in panels (A) and (B) in Müller cells. (D) ROS levels were quantified in WT and σ1RKO Müller cells using an assay to detect the oxidative conversion of carboxyl-DCFH-DA to the highly fluorescent carboxyl-DCF (495nm excitation/527nm emission). Data are mean ± S.E.M of triplicate measurements *** p< 0.001; ****p<0.0001. (CT = control, PTZ = (+)-pentazocine treated).

