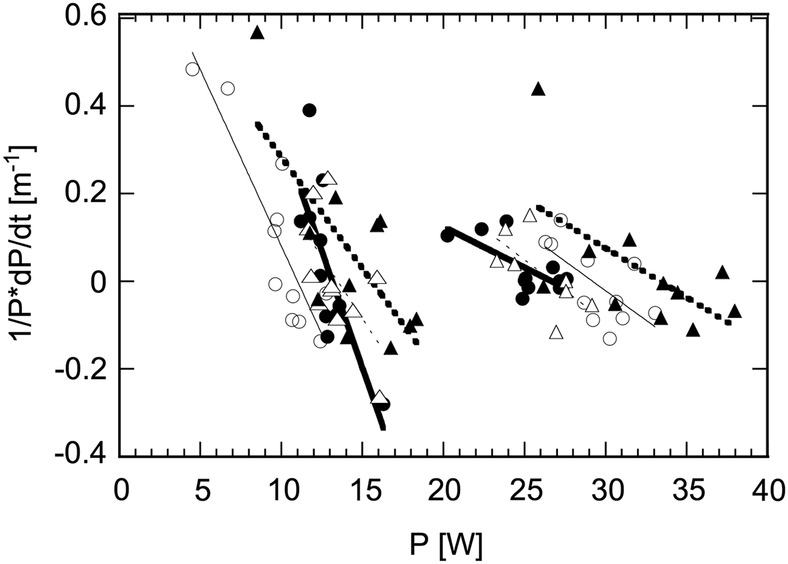
Figure 3.

The relative rate of change in power Y(P)=P−1⋅dP/dt in two successive months as a function of the power P itself. Shown are the data of four patients (group HA, >80% training participation) with a mean power of <P> <15 W and four patients (group HA) with <P> >25 W with individual linear regression fits. HA, high adherence.
