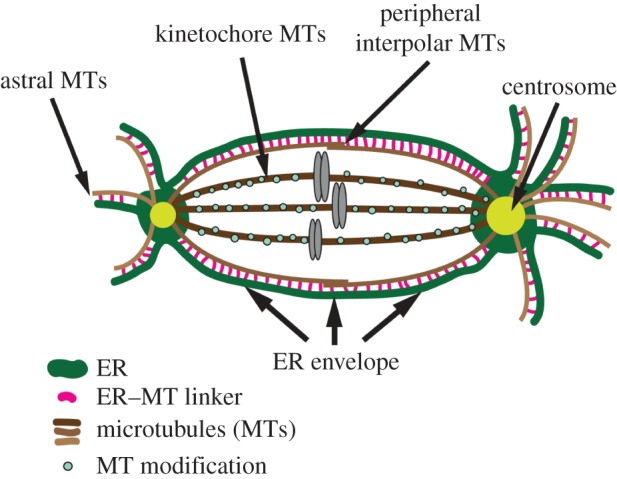
Figure 6.

Model depicting the association of the ER (green) with spindle MTs (brown). Centrosomes (yellow) and chromosomes (grey) are indicated. The entire ER network associates with either astral MTs or peripheral interpolar MTs, but not kinetochore MTs. This association is mediated by an ER–MT linker protein (pink), the identity of which is unknown. The exclusion of ER from kinetochore MTs may be due to a MT modification (blue circles) that prevents interaction of the ER–MT linker. This model depicts asymmetric centrosomes, and the amount of associated ER is a direct function of asymmetric astral MT density. This gives rise to asymmetric ER partitioning in NBs. In symmetrically dividing cells like spermatocytes (not depicted), symmetric MT densities around the two centrosomes results in symmetric ER partitioning.
