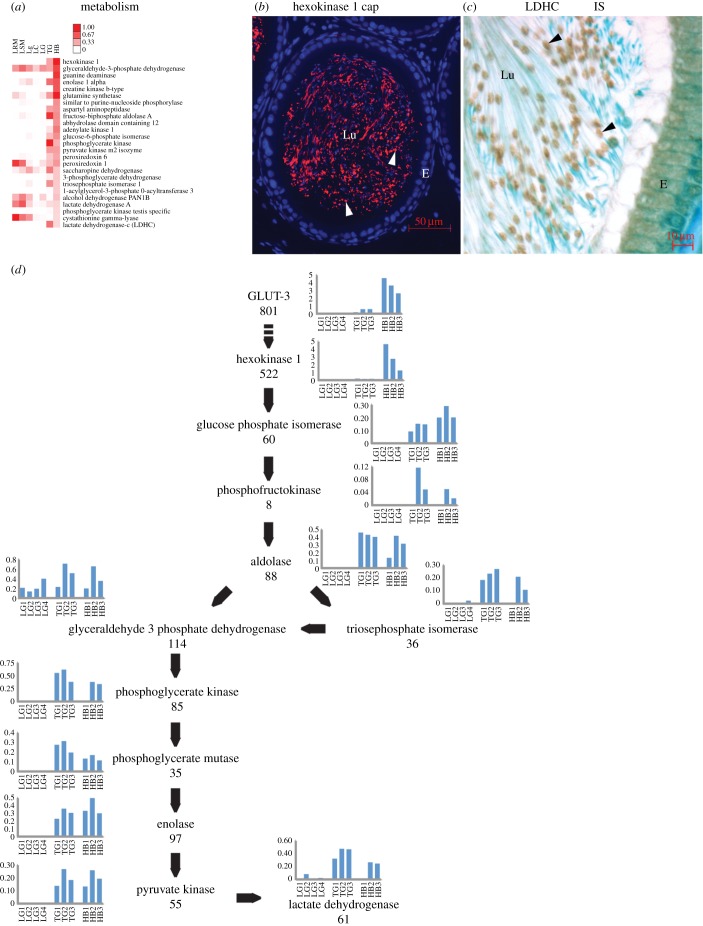
Figure 4.
Hermes body and glycolysis as deduced from protein abundances and localizations. (a) Twenty-five proteins in metabolism category. Scale indicates percentage total peptides. (b) IF of Hexokinase 1 and (c) IHC of lactate dehydrogenase C. Both show concentration in Hermes bodies of sperm in lumina of the IS. (d) Proteomics of the glycolytic pathway. Histograms represent peptide abundances in separate isolates for the indicated proteins. Total number of peptides (n = 3) characterized in the isolated Hermes bodies is indicated below each protein name. LG, liver Golgi; TG, testis Golgi. Other abbreviations as in figure 2.

