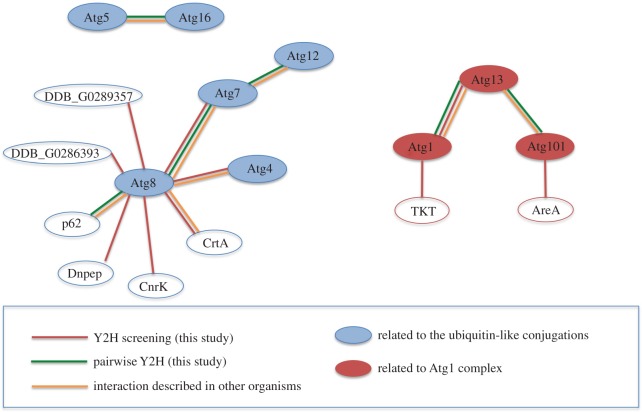
Figure 8.
Summary of interactions obtained by Y2H analysis. The data obtained from Y2H screenings and Y2H pairwise analysis are summarized in the diagram, representing the interactions between the proteins as connected coloured lines. The colour code also informs of interactions described in other organisms.

