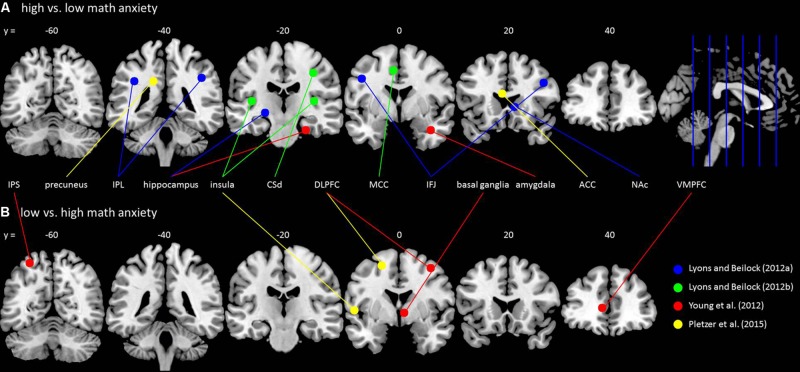
FIGURE 1.
Brain activation differences for math anxiety. (A) Brain areas showing higher activation in high math-anxious individuals compared to low math-anxious individuals. (B) Brain areas showing higher activation in low math-anxious individuals compared to high math-anxious individuals1. The circles are centered around the activation maximum of each cluster with a radius of 5 mm and are located on the y-slice next to its y-value (e.g., the slide with a y-value of 0 contains all activation maxima from –10 ≤ y ≤ 10) by using the software MRIcron (www.mricro.com/mricron). Different studies are indicated by different colors: blue – Lyons and Beilock (a); green – Lyons and Beilock (2012b); red – Young et al. (2012); yellow – Pletzer et al. (2015). Abbreviations are adapted from the original studies: ACC, anterior cingulate gyrus; CSd, dorsal segment of central sulcus; DLPFC, dorsolateral prefrontal cortex; IFJ, inferior frontal junction; IPL, inferior parietal lobe; IPS, intraparietal sulcus; MCC, midcingulate cortex; NAc, nucleus accumbens; VMPFC, ventromedial prefrontal cortex.

