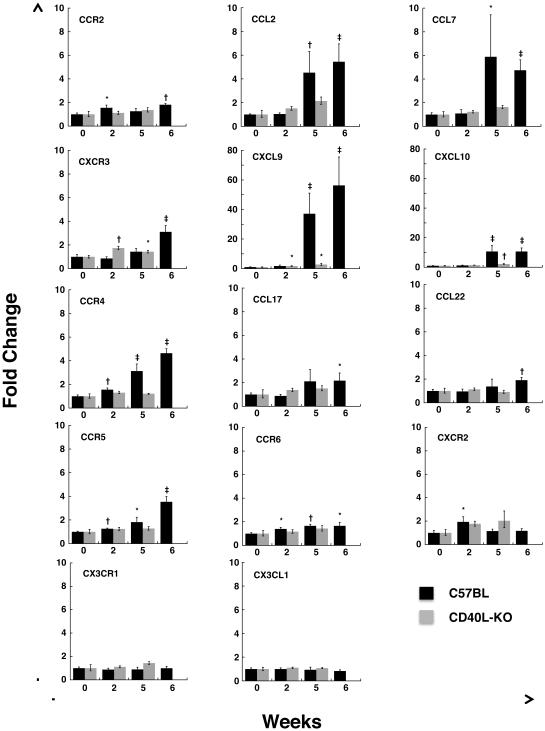
Fig. 2.
Gene expression levels of chemokines and chemokine receptors, as measured by Q-PCR, in the lungs of wild-type and CD40L-KO mice following exposure to P. murina. Wild-type and CD40L-KO mice were cohoused with Pneumocystis-infected seeder mice for 2 weeks (WT n=6, CD40L-KO n=8), 5 weeks (WT n=6, CD40L-KO n=4) and 6 weeks (WT n=6). Chemokine and chemokine receptor levels were measured in the lungs of these mice by real-time PCR and are reported as fold-change compared to unexposed animals (WT n=6, CD40L-KO n=5) using the comparative Ct method. Note the different Y axis range for Cxcl9 and Cxcl10. Error bars indicate the standard error. Statistical significance is indicated by the following symbols: *, p-value ≤ 0.05; †, p-value ≤ 0.01;‡, p-value ≤ 0.001.

