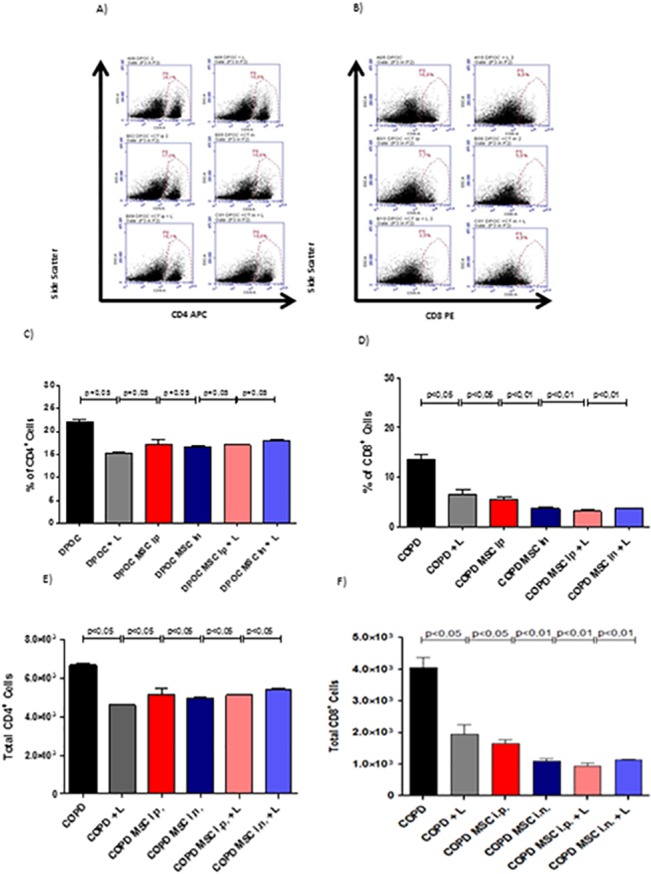
Fig 2. Reduction of T CD4+ and T CD8+ T cells infiltration in the lungs of htMSC and/or LLLT treated animals.

COPD animals were submitted to therapeutic protocols as described in materials and methods. Further, all animals were euthanized and BAL obtained for flow cytometric analysis of the frequency of CD4+ and CD8+ T cells. In (A and B), dot plots depict the gates used. In (C and D), graphs of the percentage of CD4+ and CD8+ T cells, respectively. In (E and F),graphs of the absolute numbers of CD4+ and CD8+ T cells, respectively. Data representative of two independent experiments. n = 5–8 animals per group. One-way ANOVA.
