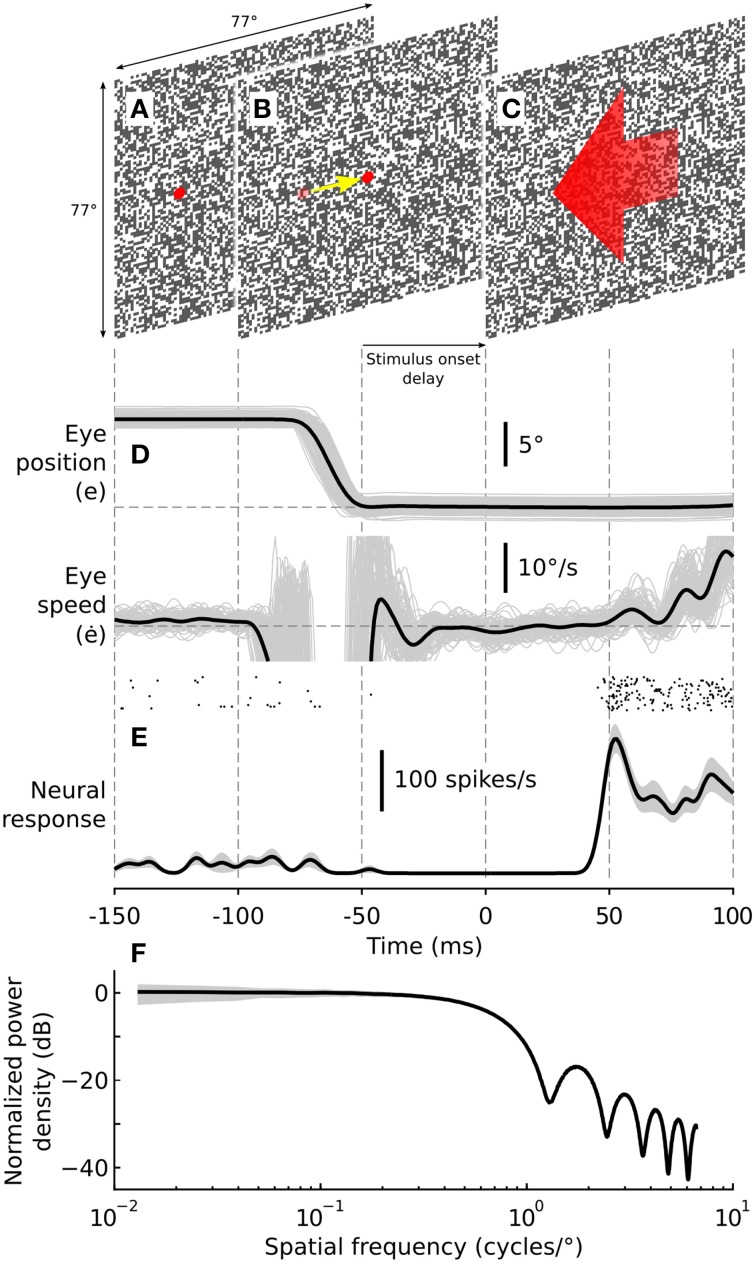
Figure 1.
Experimental methodology. Visual stimuli consisted of a random checkerboard texture, 77° × 77° with a check size of 0.8° × 0.8°. Monkeys made rewarded saccades from a peripherally presented target (A) to a centrally presented target (B). After the centering saccade the monkeys were required to maintain fixation for a nominal period of either 50 (short-delay condition) or 300 ms (long-delay condition) after which the background texture began moving (C), eliciting robust spiking responses and triggering reflexive ocular following. The post-saccadic test stimulus always moved in the preferred direction (opposite to that of the saccade) and at the preferred speed of the recorded cell. Peri-saccadic stimuli were presented at 100% contrast, and for some cells, at 0% contrast to determine the effect of visual stimulation during the saccade on the observed post-saccadic enhancement. Post-saccadic motion stimuli were always presented at 100% contrast. (D) Eye movements were recorded using scleral search coils implanted in both eyes. Eye speed of the reflexive ocular following response was calculated off-line, providing a behavioral assay for post-saccadic enhancement. Thin gray lines show eye position and speed for individual trials. The black lines show representative eye position and speed signals averaged across all trials. (E) Spiking activity was recorded from visual neurons in the dorsal part of the medial superior temporal area (MSTd). The raster plot shows spike arrival times from a representative neuron for all trials (n = 20). The black line shows the mean spike density function while the shaded region shows ±1 SE. (F) Normalized orientation averaged power spectrum of the post-saccadic test stimulus. The black line shows the power spectrum averaged over 1000 random texture samples, normalized to the mean power at 0.1 cycles/°. The shaded region shows the standard deviation over the random texture samples. The power spectrum is flat up to approximately 0.625 cycles/°, falling off gradually thereafter with increasing spatial frequency. At 0.1 cycles/° the stimulus has an orientation averaged power spectral density equal to the RMS contrast power of a cosine grating with Michelson contrast 57.8%.

