Figure 1.
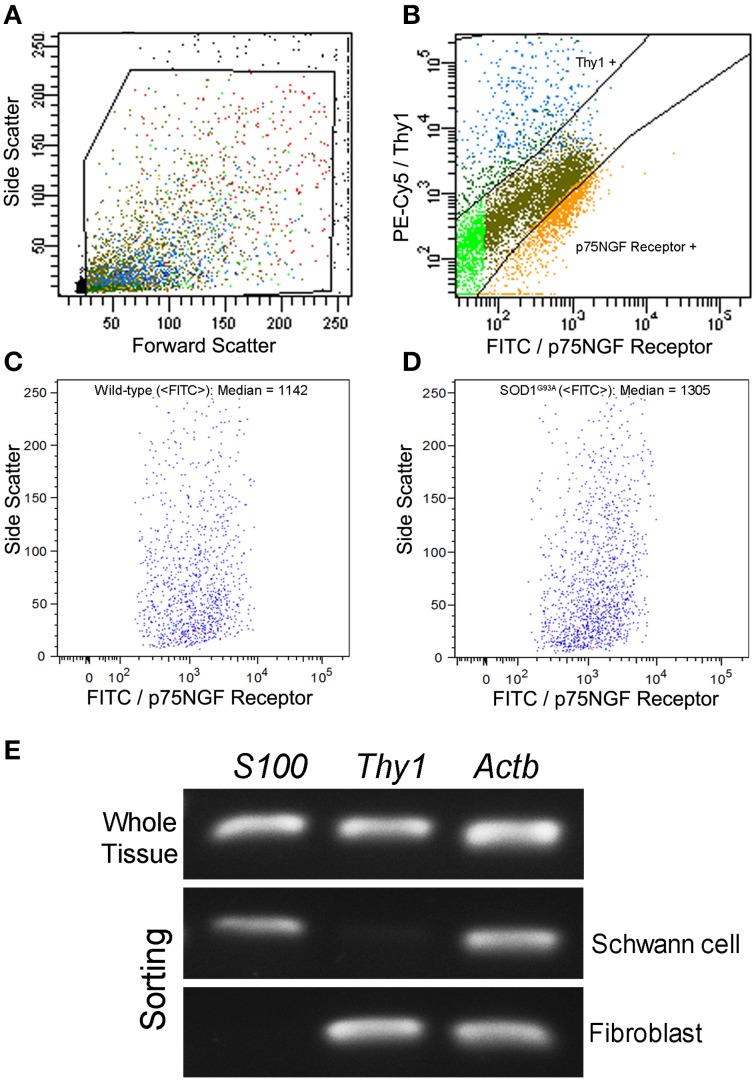
Flow cytometry cell sorting (A–D) and PCR analysis of Schwann cell and fibroblast markers (E) from sciatic nerve of 60-day-old presymptomatic SOD1G93A and the wild-type controls. FITC-conjugated p75NGF Receptor and PE-Cy5-conjugated Thy1 antibodies were employed in the two-color immunolabeling of Schwann cells and fibroblasts, respectively (A,B). Dot plots indicate the total number of events in the sciatic nerve cell suspension, and the dots inside the box represent the excluded doublet and dead profiles, which have been eliminated by morphological criteria, according to previous descriptions (Herzenberg et al., 2006) (A). After morphological criteria, dot plots of Schwann cell and fibroblast profiles (B) were obtained using respective fluorescence filters and the blots inside the boxes represent the specific profiles after discounting the unspecific labeling. Positive p75NGF Receptor and Thy1 cell profiles are shown in corresponding boxes after FITC vs. PE-Cy5 fluorescence intensity plotting (B). Specific profiles-based on morphological criteria were further analyzed in relation to fluorescence criteria and the specific p75NGF Receptor positive Schwann cells profiles were identified in wild-type (median of FITC = 1142; C), and in SOD1G93A mice (median of FITC = 1305; D). Representative bands of PCRs for specific gene markers of Schwann cells (S100), fibroblasts (Thy1), and actin b (Actb) were searched in Schwann cells and fibroblasts enriched samples obtained by flow cytometry sorting of SOD1G93A mice. Mouse whole sciatic nerve sample was used as a positive control (E).

