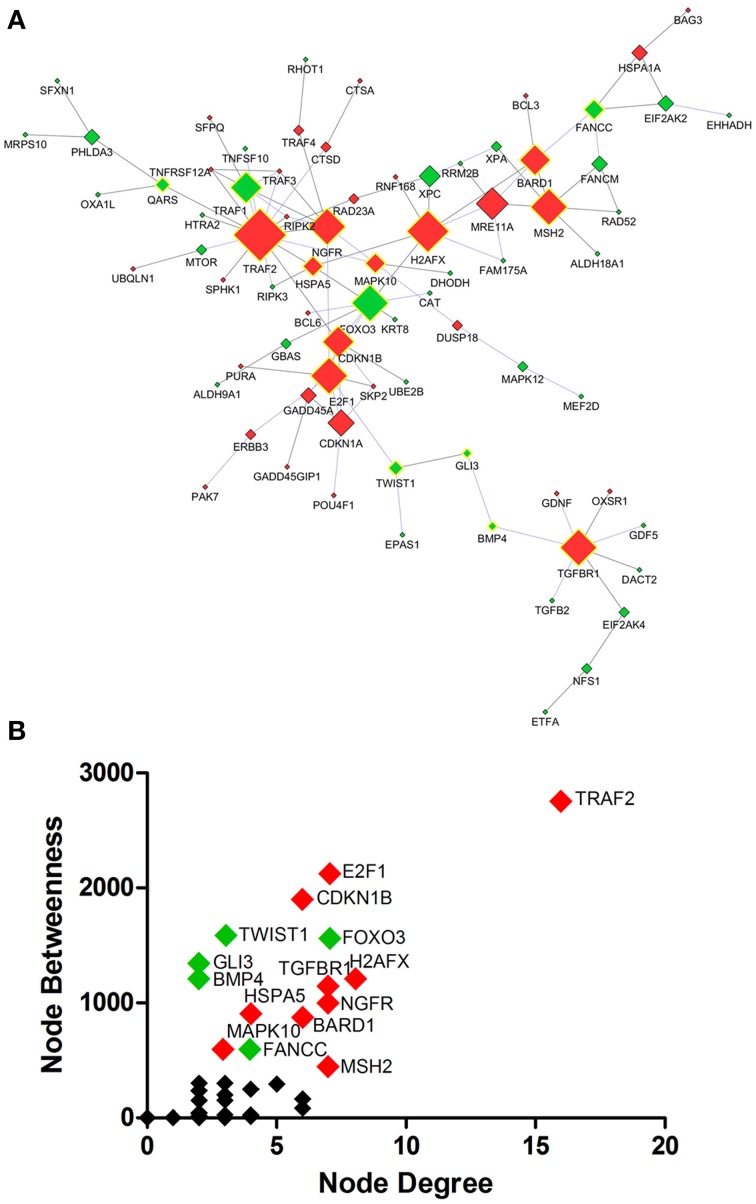
Figure 5.
Protein interaction network developed from differentially expressed genes related to Death, Stress and Mitochondrion of sciatic nerves from SOD1G93A mice (A). Scatter plot of the correlation between highest values of node degree (hubs) and node betweenness (bottlenecks) is shown in (B), as described in the text. Up and down-regulated genes are represented respectively as red and green diamonds. Nodes with the highest values for node degree (number of connections) and node betweenness (number of shortest paths) are represented with a yellow border. Of note from this analysis, the genes E2f1, Foxo3, Gli3, Ngfr, Cdkn1a or their related products were already described in the context of ALS.

