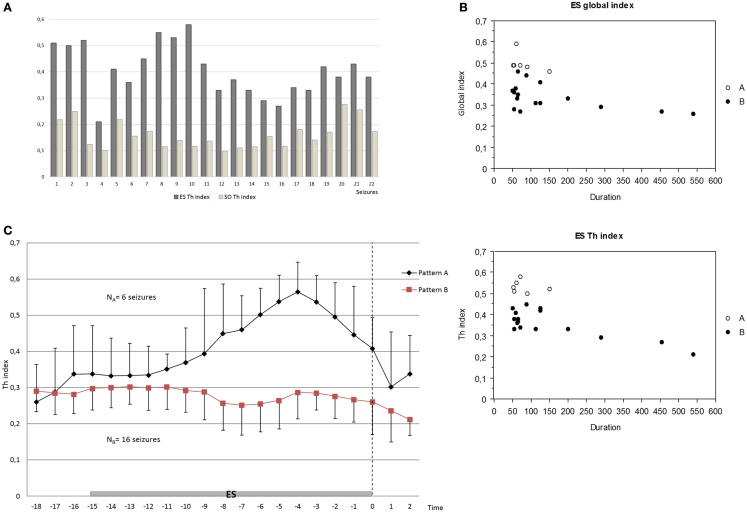
Figure 3.
(A) Increase of the thalamic synchronization index (Th index) in the ES period compared to the SO period in all seizures analyzed (p < 0.0001 for each comparison) by Wilcoxon test. (B) Negative correlation between global index and seizure duration (p = 0.045) and inverse tendency between Th index and seizure duration (p = 0.052, R2 0.40) in the ES period by Spearman test. (C) Different patterns of the increase of thalamic connectivity between groups A and B in the ES period; pattern A seizures (NA = 6) showed an overall stable, higher, and longer increase of thalamo-cortical synchronization clearly before the end of seizure compared to pattern B seizures (NB = 16). The mean and the average deviation of values are shown. Dashed arrow indicates the end of seizure.

