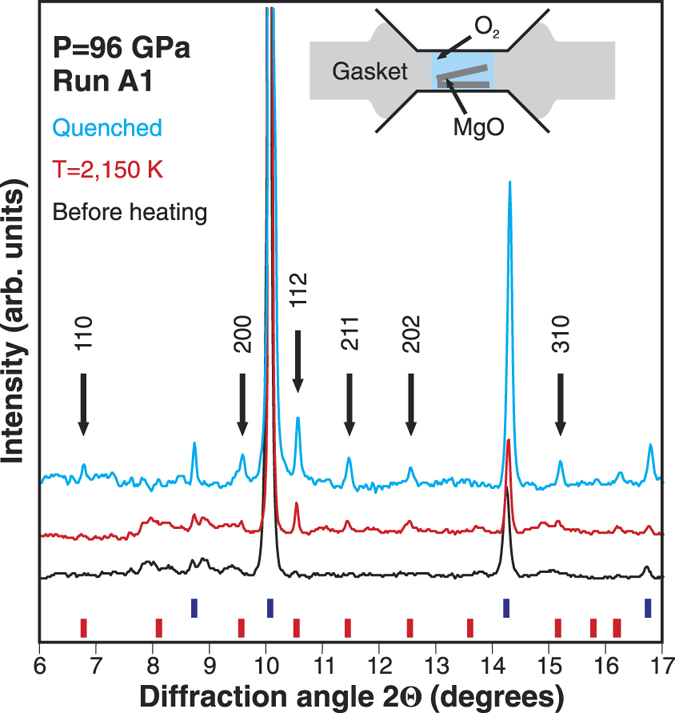
Figure 1. X-ray diffraction (XRD) pattern of the A1 sample before laser heating (black line), at high temperature (red line) and quenched to 300 K (blue line).

Arrows mark new peaks that appear at high temperature. A thermal shift of the MgO peaks is seen at T = 2150 K indicating a uniform heating of the sample. Miller indices correspond to the indexed tetragonal unit cell. Expected positions of I4/mcm MgO2 Bragg reflections12 are shown by red ticks. Blue bars correspond to MgO. Oxygen peaks are not resolved. The wavelength is 0.3344 Å. The inset shows the experimental assemblage of type-A runs.
